Global Paymasters - how many do you own in your portfolio?In many countries, you would have some payment processing companies with the global brand like Visa, Mastercard, Paypal dominating. In China, we have Tencent and Alibaba which I am invested in.
So, if you like the fundamentals and growth story of these payment companies, buying into the ETFs may b
Key stats
About Global X FinTech ETF
Home page
Inception date
Sep 12, 2016
Structure
Open-Ended Fund
Replication method
Physical
Dividend treatment
Distributes
Distribution tax treatment
Qualified dividends
Income tax type
Capital Gains
Max ST capital gains rate
39.60%
Max LT capital gains rate
20.00%
Primary advisor
Global X Management Co. LLC
Distributor
SEI Investments Distribution Co.
FINX offers cross-sector exposure to the emerging financial technology (FinTech) theme. The fund specifically includes developed markets securities with significant exposure to at least one of six FinTech themes: mobile payments, marketplace lending, crowdfunding, enterprise solutions, blockchain and alternative currencies, and personal finance software and automated wealth management services. Since the stocks straddle the line between financials and technology, they can benefit from but are also susceptible to sector-wide shocks to either sector. FINX aims to hold up to 100 FinTech companies, selected and weighted by market-cap. Constituents are then constrained such that no individual security exceeds 6% weight and the aggregate weight of securities with over 5% allocation is capped at 40% weight of the portfolio. The index rebalances and reconstitutes annually.
Related funds
Classification
What's in the fund
Exposure type
Technology Services
Commercial Services
Finance
Stock breakdown by region
Top 10 holdings
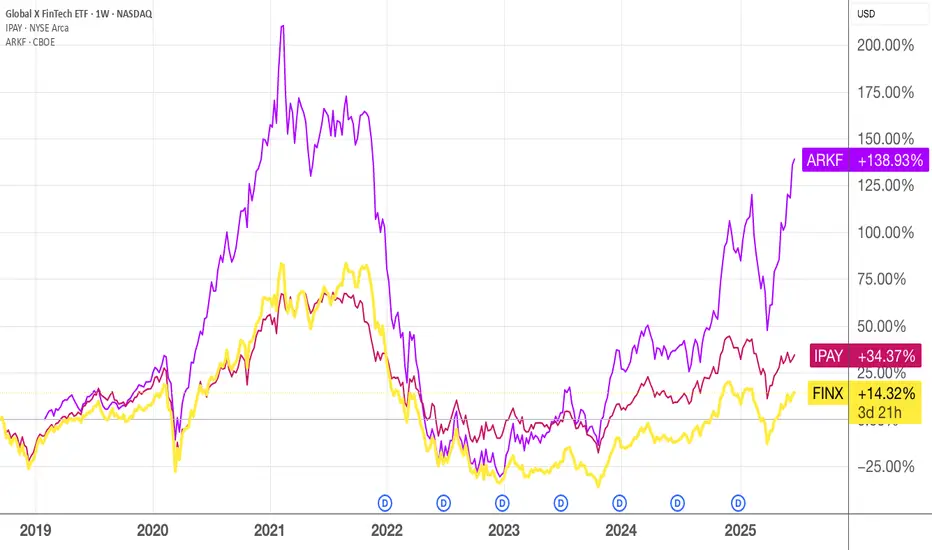
Global X Fintech ETFComparing the performance of the Global X Fintech ETF vs. S&P 500 and NASDAQ indexes since 7/31/2021.


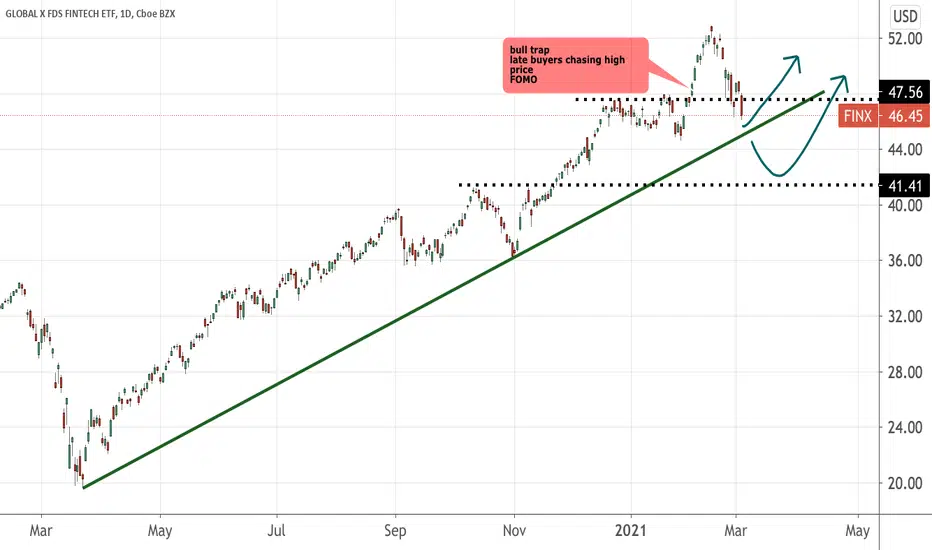
Wait for price to come to you Yes, I know it is not easy to control yourself like when you are in a mall looking at all those lovely things you want to buy off the shelves.
But is the price at a discount ? Then, you worried , what if this bag runs out of stock? What if the price goes up some more ? Now, handbags at retail malls
This 1.1$-Trillion Industry Will End Up Like RetailBanks have grown very, very rich in the last 30 years—thanks to their privileged monopoly position.
JPMorgan Chase (JPM), America’s largest bank, has grown profits by 2,000%+ in the last 30 years.
Bank of America (BAC), the second-largest American bank, has seen its profits surge 4,700%.
JP Morga


See all ideas
Summarizing what the indicators are suggesting.
Oscillators
Neutral
SellBuy
Strong sellStrong buy
Strong sellSellNeutralBuyStrong buy
Oscillators
Neutral
SellBuy
Strong sellStrong buy
Strong sellSellNeutralBuyStrong buy
Summary
Neutral
SellBuy
Strong sellStrong buy
Strong sellSellNeutralBuyStrong buy
Summary
Neutral
SellBuy
Strong sellStrong buy
Strong sellSellNeutralBuyStrong buy
Summary
Neutral
SellBuy
Strong sellStrong buy
Strong sellSellNeutralBuyStrong buy
Moving Averages
Neutral
SellBuy
Strong sellStrong buy
Strong sellSellNeutralBuyStrong buy
Moving Averages
Neutral
SellBuy
Strong sellStrong buy
Strong sellSellNeutralBuyStrong buy
Displays a symbol's price movements over previous years to identify recurring trends.
Frequently Asked Questions
An exchange-traded fund (ETF) is a collection of assets (stocks, bonds, commodities, etc.) that track an underlying index and can be bought on an exchange like individual stocks.
FINX trades at 35.28 USD today, its price has risen 0.56% in the past 24 hours. Track more dynamics on FINX price chart.
FINX net asset value is 35.26 today — it's risen 4.26% over the past month. NAV represents the total value of the fund's assets less liabilities and serves as a gauge of the fund's performance.
FINX assets under management is 318.37 M USD. AUM is an important metric as it reflects the fund's size and can serve as a gauge of how successful the fund is in attracting investors, which, in its turn, can influence decision-making.
FINX price has risen by 4.58% over the last month, and its yearly performance shows a 38.10% increase. See more dynamics on FINX price chart.
NAV returns, another gauge of an ETF dynamics, have risen by 4.26% over the last month, showed a 25.39% increase in three-month performance and has increased by 37.66% in a year.
NAV returns, another gauge of an ETF dynamics, have risen by 4.26% over the last month, showed a 25.39% increase in three-month performance and has increased by 37.66% in a year.
FINX fund flows account for −57.79 M USD (1 year). Many traders use this metric to get insight into investors' sentiment and evaluate whether it's time to buy or sell the fund.
Since ETFs work like an individual stock, they can be bought and sold on exchanges (e.g. NASDAQ, NYSE, EURONEXT). As it happens with stocks, you need to select a brokerage to access trading. Explore our list of available brokers to find the one to help execute your strategies. Don't forget to do your research before getting to trading. Explore ETFs metrics in our ETF screener to find a reliable opportunity.
FINX invests in stocks. See more details in our Analysis section.
FINX expense ratio is 0.68%. It's an important metric for helping traders understand the fund's operating costs relative to assets and how expensive it would be to hold the fund.
No, FINX isn't leveraged, meaning it doesn't use borrowings or financial derivatives to magnify the performance of the underlying assets or index it follows.
In some ways, ETFs are safe investments, but in a broader sense, they're not safer than any other asset, so it's crucial to analyze a fund before investing. But if your research gives a vague answer, you can always refer to technical analysis.
Today, FINX technical analysis shows the buy rating and its 1-week rating is buy. Since market conditions are prone to changes, it's worth looking a bit further into the future — according to the 1-month rating FINX shows the strong buy signal. See more of FINX technicals for a more comprehensive analysis.
Today, FINX technical analysis shows the buy rating and its 1-week rating is buy. Since market conditions are prone to changes, it's worth looking a bit further into the future — according to the 1-month rating FINX shows the strong buy signal. See more of FINX technicals for a more comprehensive analysis.
Yes, FINX pays dividends to its holders with the dividend yield of 0.48%.
FINX trades at a premium (0.07%).
Premium/discount to NAV expresses the difference between the ETF’s price and its NAV value. A positive percentage indicates a premium, meaning the ETF trades at a higher price than the calculated NAV. Conversely, a negative percentage indicates a discount, suggesting the ETF trades at a lower price than NAV.
Premium/discount to NAV expresses the difference between the ETF’s price and its NAV value. A positive percentage indicates a premium, meaning the ETF trades at a higher price than the calculated NAV. Conversely, a negative percentage indicates a discount, suggesting the ETF trades at a lower price than NAV.
FINX shares are issued by Mirae Asset Global Investments Co., Ltd.
FINX follows the Indxx Global Fintech Thematic Index. ETFs usually track some benchmark seeking to replicate its performance and guide asset selection and objectives.
The fund started trading on Sep 12, 2016.
The fund's management style is passive, meaning it's aiming to replicate the performance of the underlying index by holding assets in the same proportions as the index. The goal is to match the index's returns.