Five ShortI ended up shorting five after a poor decision to close my 2 previous spy trending trades.
Over leveraged my account. I got emotional. My original plan was to drop from $200 puts/calls to $100 but I instead went for this one and another trade.
I realized afterwards that it was a folly once my senses kicked in. I bought to puts accidentally. sold one quickly for a loss of $30.
toward the end of the day. I ended up make $30 on this trade to break even after going red through the day.
it was a big mistake.
This is a personal journal reference.
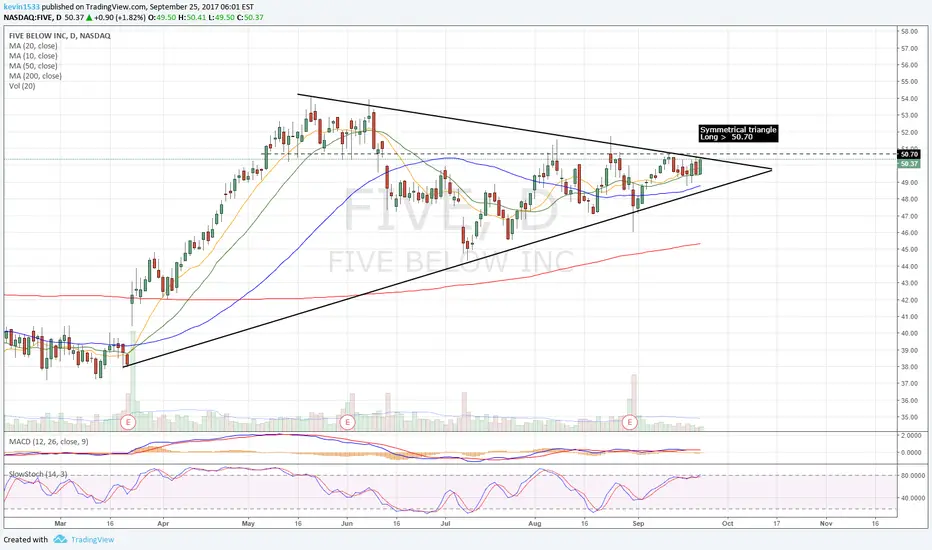
FIVE trade ideas

Bullish if ER will beat!TTM squeeze showing an uptrend
Slow Stochastic oversold turning to the upside for bullish trend reversal
ADX reversal

Five Below is a definite watch!Five below is a growing company that is going to help fill the Toys R Us void that has happened. Amazon is pushing to fill the void as well. However FIVE specializes in a market that is hard for Amazon to compete in. With earnings coming at the end of November it could be the catalyst to propel it to 180. If not it will be the earnings in February for the holiday season.


FIVE flat Symbol FIVE
EPS due date: 11/29/18
Horizontal S&R: yes
Channel S&R: yes
MA S&R: yes
>200ma: yes
Volume confirmation: huge
Candle Confirmation: no
Stoch Divergence: yes
Reg Trendline >85: 88
Short Float: 14%
Stop 108.5
Price Target 134
Risk / Reward: 2
Zacks Rank: 2-Buy 2 Style Scores: F Value | B Growth | C Momentum | C VGM Industry Rank: Top 27%(70 out of 257) Industry: Retail - Miscellaneous
Any feedback is welcomed.

FIVE adding to watch listZacks Rank: 2-Buy 2 Style Scores: F Value | B Growth | D Momentum | D VGM Industry Rank: Top 43%(109 out of 255) Industry: Retail - Miscellaneous
looking for long. . . waiting for bullish candles and some volume.
comments welcomed


$FIVE - ready for next leg up? One of my favorite setups.... gap up and tight consolidation. Feels ready to go

HigH FIVE!Ok this is a Huuuuge retest gap. Everyone going to be taking some profits in the next few days.. Just needs to get below low of todays candle to start the run to the exit.. I see this pulling back to about 91 to be conservative. Buy some puts or shares.. I also like the indecision candle forming right now too.

FIVE - Slow and Steady ?FIVE - RSI and Money flow seems negative but price chart shows that it has been in a consolidation zone and ready for a breakout. It didn't fall much during market turmoil indicating investors belief in it. I think it is a good bet for long term investors in retail sector.
Note: Always consider overall market trend before looking at individual stock trends.
Disclaimer: This is just my opinion, not an advice. Trade at your own risk.

FIVE: bullish trends on monthly, weekly chartsOn monthly charts, prices have consistently rebounded from tests of the 6-month moving average without event getting close to the 10-month average while a bullish trend reading persists on monthly ADX. Volume has been best on bullish months. Stochastics is at high readings, but this is not an overbought reading because of the bullish ADX trend. Daily and weekly charts are also positive, providing opportunities to enter on pullbacks.

A Breakout Trade on FIVEIBD Rating of 96, broke out this morning from a cup and handle on the weekly charts. Latest EPS growth was 31%... so fundamentally this baby is smoking.
Long Stop at 71.50.... TP 89.75 SL 66.50

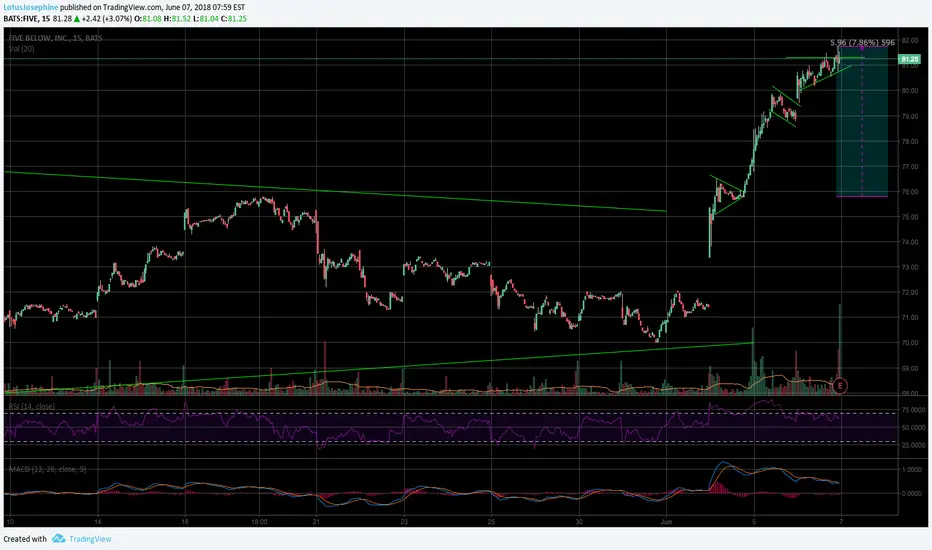
FIVE Long* I use this function to simply journal/map my trades, follow at own risk*
Simple Divergence Strat for both RSI and Stoch, good fundamentals on company.
Buy In - $68
Stop - $66.99
Cover - $69
Target 1 - $73.34
Long Target - $75.25
Long Target - $77

Bar data missing now appears$FIVE 3/2/2018 entire day of trading data missing before tweet now appears. Thanks for the fix but it's scary to think these glitches exist. They are hard to catch unless you check each bar against other software. Happens too often. There are a lot of things I like about this platform but the layouts are too restrictive as they cannnot be manipulated and the data , more importantly, is unreliable.


Write PUTS A pullback is taking place, which may present a nice opportunity for an entry. (SELL PUTS) There is a support zone below the current price at 61.36, a sell puts order could be placed below this zone.