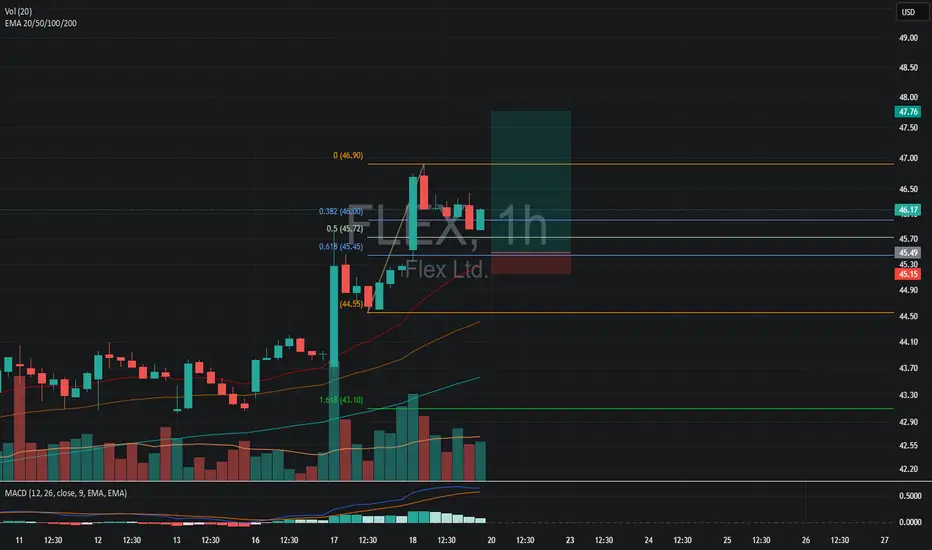
FLEX on WatchWhy:
Possibly pullback to 20EMA which lines up with 0.618 fib level
MACD looks like its going to turn bearish
Daily uptrend
FLEX trade ideas
Flex - Uptrend has resumedNASDAQ:FLEX has returned to the uptrend after completing its ABC corrective wave structure when bullish pressure was seen rebounding strongly above 123.6%-100.00% expansion of wave A-B. Prices has also trends back into the uptrend line which started since July 2022.
Stochastic Oscillator (63,13,13) has confirmed the oversold signal and long-term MACD is close to perform a crossover reversal at the bottom.
We believe that upside will likely to continue and may see US$40.00 as a target in the short-term before correcting. hence, we are allocating major position size at 34.11 and 30.08 support to gun for a strong and long-term rebound.

Flex ltd., Wave 5, the first TP is the previous highFlex ltd., Wave 5, the first TP is the previous high NASDAQ:FLEX

FLEX - Oct 24 Opening Sustainable Momentum
RUT and SPX both started rallying together and most of the market became green. RUT confirmed the bullish hammer by breaking a previous high. SPX's rally further confirmed a successful bullish breakout.
FLEX had a momentum signal and had broken through a key resistance point that was previously rejected on the 27 Sep. I placed an entry position on the high of the H2 candle and got filled.
Opening Sustainable Momentum 🧑🏻🚀
Strategy
Signals identify market opening H2 candles through momentum and behaviour change that potentially could indicate a shift in the current price overall structure (Price gaps and ADR %).
Risk
We use the signal candle's highs and lows for entry and stop loss. If price hits the stop loss, it is clear that the shift we expected did not come to fruitation.
Current SL is at 0.25Fib
Stock Pool
Shortlisted Mid to Small cap Tech stocks that have clear D1 and H2 price movement (Not choppy). Historically has shown price movements aligned to high impact moves in on the RUT index.
Focus
Focus is never on the signal candle alone, but it's role in the larger structure and the direction it is inclined towards with a minimum Risk & Reward of 2R.
Stock must be in a pull back or consolidation area waiting for a broad market momentum to ignite it forward.
Character
Trend, Positive Skew

FLEX - Aug 24 V2 MATrend Sustainable Momentum
Potential breakout from range, 12.9B company which makes it closer to RUT
RUT had a massive breakout from it's consolidation at market open. Once the H1 candle closed I started looking for Long positions like FLEX
V2 MATrend Sustainable Momentum (Systematic) 🚀
This is an iteration of the MATrend Sustainable Momentum System.
- Portfolio of shortlisted Tech stocks with a positive backtest across the past 6 years
- Signals identify market opening H1 candles that potentially could indicate a change the current price behaviour or structure.
- Focus is on the larger setup and the direction it is inclined towards with a minimum of a Risk & Reward factor of 2

FLEX - attractive growth at a bargain priceFLEX is rated “Buy” with a 12-month target price of 33.92, a 14.13% upside from the current price of 29.72. Our in-house valuation suggests fair price of $42 per share, implying attractive 41% upside potential for the stock in the next 12-months period.
Technical Chart indicates that the stock is close to breakout the 100 -days MA. The company is reporting today - should that be positive surprise, we would expect a bullish swing trade.

FLEX - JUNE 24 MATrend Unsustainable Momentum This trade hit my SL before moving down and capturing 19R! I reviewed this trade and update my system rules to update the fib plot when there are new highs.
MATrend Unsustainable Momentum (Systematic) ⏪
The strategy identifies stocks (Tech sector ) that follows the larger market regime's momentum of the day and because they are unable to maintain it price breaks down quickly
Tight stops aligned to the price behaviour we are trying to capture. Which is a rapid break of the momentum.

FLEX waiting for 27.99, double bottomFLEX waiting for 27.99, double bottom, entry 28.00, SL 27.94 TP1 28.18 TP2 28.30 TP3 28.42

FLEX retested support at 20$ and ready to go HIGHERFLEX broke out of a cup and handle pattern in November. And this was a 3 year cup with a 2 year handle. After hitting ATH in January, it has retraced to the breakout level at 20$ with lower volume. Wednesday's earnings were the trigger to wake up FLEX once again. Looking for an opportunity to add to portfolio.

Flex in monthly supply and looking for a short FLEX inside monthly supply zone. Broke weekly supply zone. Sell Volume increasing, CMF falling down. Short trade opportunity 2.5 RR available ?

FLEX, LONGWell , take two. After I de risked the first time , the trades raised stop hit , and kicked me to the curb .
That's one thing about the way I like to de risk , lots of stop outs and the requirement to get back in when the stock tells me to .
I am not a fan of the looser price action here last few days , still a TT's name with a major 2/2 gap open and strong RS ...


FLEX breakout!Breakout and retest complete above a long term support level. Inverse head and shoulders pattern.

$FLEX possible Breakout for an outside yearDo you see anything interesting here?
6 years with positive earnings

Bull Flag Visible on Weekly Timeframe with MACD Bullish CrossThis is a company that has quite a good P/E and has Bounced from the bottom of a Parallel Channel after printing Bullish Divergence on the MACD. As of today the weekly has closed near the breakout point of the Channel and has confirmed a Bullish MACD Crossover above all the major Moving Averages.
Due to all this i expect that upon breaking above the channel we will have a Blue Sky Breakout that could take us to $28-$30

Long | FLEXNASDAQ:FLEX
Possible Scenario: LONG
Evidence: Price Action
TP1~ 19$
TP2~ 20$
Call options, Strike 20$, 05/21/21
This is my idea and could be wrong 100%,

FLEX looks great$FLEX with a nice breakout. Love to see it trade a backtest for a week or two then explode rip into earnings 3 weeks out
- Trading above all significant MAs
- Breaking the band open
- Cleared some serious volume nodes
- 8 EMA crossing 21EMA while closing above 50SMA
Bullish!!!!

$FLEX - above the 50Flex closed above the 50 MA
MACD is reversing and the stochastic is starting to move as well
The sentiment is going down, however when sentiment is down, if the short volume picks up, this can really move.
Two scenarios:
1. pick it up now and you may need to hold for up to 60 days for returns
2. wait for sentiment to reverse and hop in once supply has dwindled

Long | FLEXNASDAQ:FLEX
Possible Scenario: LONG
Evidence: Price Action
This is my idea and could be wrong 100%
TP1 ~21 for next week, easy 7% Profit


FLEX: Ascending Triangle, ConfirmedAscending Triangle, confirmed
Pros:
Descending volume during formation
Volume increase at Break out
PPS above 50MA and 200MA
ATR ascending, more volatility
RS ascending and above 0
R/R ratio above 8
250MA above 50
Cons:
200MA flat
May close gap and reverse at 16.57$
Targets:
PT1 = 17,40$

