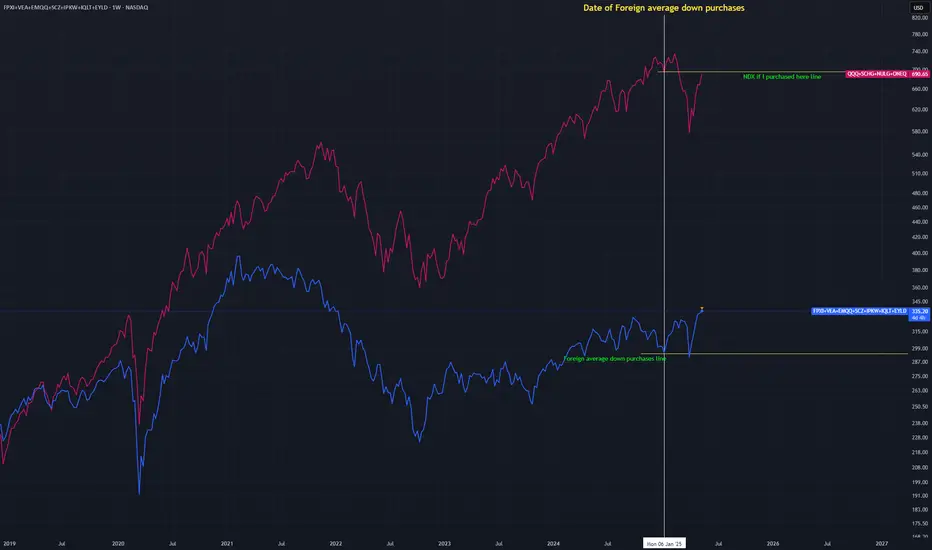
NDX Index Funds Vs Foreign NDX funds performance post rotationThis nothing but an idea I am publishing to track my performance for rotating profits in NDX funds into averaging down foreign funds in a retirement portfolio. I want to point out had taken profits previously and was trading bitcoin and GME with them until i found a candidate for rotation at a pric
Key stats
About First Trust International Equity Opportunities ETF
Home page
Inception date
Nov 4, 2014
Structure
Open-Ended Fund
Replication method
Physical
Dividend treatment
Distributes
Distribution tax treatment
Qualified dividends
Income tax type
Capital Gains
Max ST capital gains rate
39.60%
Max LT capital gains rate
20.00%
Primary advisor
First Trust Advisors LP
Distributor
First Trust Portfolios LP
FPXI holds positions in the 50 largest international firms with recent IPOs, weighted by market cap. Eligible stocks are purchased after the close on the 6th trading day and sold on the 1000th, for a holding period of roughly 4 years. The fund applies further quantitative screens in addition to the usual de minimis size and liquidity requirements, but these are fairly relaxed: a minimum market cap of $50M at the close of the first trading day, publicly traded float of at least 15%, and no abnormal underpricing defined as a first-day price increase more than 3 sigma above the mean. A 10% issuer cap is also in place. The index is reconstituted and rebalanced quarterly. This process results in an eclectic basket that can change significantly when new firms enter and older ones age out. Overall, its a good option for investors looking to access relatively fresh stock issues. See sibling funds FPX and FPXE for US and Europe exposure, respectively, using the same methodology.
Related funds
Classification
What's in the fund
Exposure type
Technology Services
Electronic Technology
Health Technology
Finance
Stock breakdown by region
Top 10 holdings
Summarizing what the indicators are suggesting.
Oscillators
Neutral
SellBuy
Strong sellStrong buy
Strong sellSellNeutralBuyStrong buy
Oscillators
Neutral
SellBuy
Strong sellStrong buy
Strong sellSellNeutralBuyStrong buy
Summary
Neutral
SellBuy
Strong sellStrong buy
Strong sellSellNeutralBuyStrong buy
Summary
Neutral
SellBuy
Strong sellStrong buy
Strong sellSellNeutralBuyStrong buy
Summary
Neutral
SellBuy
Strong sellStrong buy
Strong sellSellNeutralBuyStrong buy
Moving Averages
Neutral
SellBuy
Strong sellStrong buy
Strong sellSellNeutralBuyStrong buy
Moving Averages
Neutral
SellBuy
Strong sellStrong buy
Strong sellSellNeutralBuyStrong buy
Displays a symbol's price movements over previous years to identify recurring trends.
Frequently Asked Questions
An exchange-traded fund (ETF) is a collection of assets (stocks, bonds, commodities, etc.) that track an underlying index and can be bought on an exchange like individual stocks.
FPXI trades at 56.33 USD today, its price has fallen −0.04% in the past 24 hours. Track more dynamics on FPXI price chart.
FPXI net asset value is 56.47 today — it's risen 1.69% over the past month. NAV represents the total value of the fund's assets less liabilities and serves as a gauge of the fund's performance.
FPXI assets under management is 149.97 M USD. AUM is an important metric as it reflects the fund's size and can serve as a gauge of how successful the fund is in attracting investors, which, in its turn, can influence decision-making.
FPXI price has risen by 2.16% over the last month, and its yearly performance shows a 21.87% increase. See more dynamics on FPXI price chart.
NAV returns, another gauge of an ETF dynamics, have risen by 1.69% over the last month, showed a 14.88% increase in three-month performance and has increased by 20.04% in a year.
NAV returns, another gauge of an ETF dynamics, have risen by 1.69% over the last month, showed a 14.88% increase in three-month performance and has increased by 20.04% in a year.
FPXI fund flows account for −22.66 M USD (1 year). Many traders use this metric to get insight into investors' sentiment and evaluate whether it's time to buy or sell the fund.
Since ETFs work like an individual stock, they can be bought and sold on exchanges (e.g. NASDAQ, NYSE, EURONEXT). As it happens with stocks, you need to select a brokerage to access trading. Explore our list of available brokers to find the one to help execute your strategies. Don't forget to do your research before getting to trading. Explore ETFs metrics in our ETF screener to find a reliable opportunity.
FPXI invests in stocks. See more details in our Analysis section.
FPXI expense ratio is 0.70%. It's an important metric for helping traders understand the fund's operating costs relative to assets and how expensive it would be to hold the fund.
No, FPXI isn't leveraged, meaning it doesn't use borrowings or financial derivatives to magnify the performance of the underlying assets or index it follows.
In some ways, ETFs are safe investments, but in a broader sense, they're not safer than any other asset, so it's crucial to analyze a fund before investing. But if your research gives a vague answer, you can always refer to technical analysis.
Today, FPXI technical analysis shows the buy rating and its 1-week rating is buy. Since market conditions are prone to changes, it's worth looking a bit further into the future — according to the 1-month rating FPXI shows the buy signal. See more of FPXI technicals for a more comprehensive analysis.
Today, FPXI technical analysis shows the buy rating and its 1-week rating is buy. Since market conditions are prone to changes, it's worth looking a bit further into the future — according to the 1-month rating FPXI shows the buy signal. See more of FPXI technicals for a more comprehensive analysis.
Yes, FPXI pays dividends to its holders with the dividend yield of 0.86%.
FPXI trades at a premium (0.25%).
Premium/discount to NAV expresses the difference between the ETF’s price and its NAV value. A positive percentage indicates a premium, meaning the ETF trades at a higher price than the calculated NAV. Conversely, a negative percentage indicates a discount, suggesting the ETF trades at a lower price than NAV.
Premium/discount to NAV expresses the difference between the ETF’s price and its NAV value. A positive percentage indicates a premium, meaning the ETF trades at a higher price than the calculated NAV. Conversely, a negative percentage indicates a discount, suggesting the ETF trades at a lower price than NAV.
FPXI shares are issued by AJM Ventures LLC
FPXI follows the IPOX International Index. ETFs usually track some benchmark seeking to replicate its performance and guide asset selection and objectives.
The fund started trading on Nov 4, 2014.
The fund's management style is passive, meaning it's aiming to replicate the performance of the underlying index by holding assets in the same proportions as the index. The goal is to match the index's returns.