FROG RISKAs of mid-May 2025, here’s the latest on JFrog Ltd. (NASDAQ: FROG):
📈 Stock Price
Current Price: Around $40.43 (as of May 12, 2025)
Post-Trading Price: $41.25
52-Week Range: $22.91 – $43.00
Market Cap: Approximately $4.63 billion
P/E Ratio: ~124.05 (normalized)
Dividend Yield: 0% (no dividend)
🏢 Company Overview
JFrog Ltd. provides a universal DevOps platform that supports the secure and continuous delivery of software updates. Its key products include:
JFrog Artifactory (package repository)
JFrog Pipelines (CI/CD automation)
JFrog Xray (security scanning)
JFrog Distribution, Mission Control, and Insight
The company is headquartered in Sunnyvale, California, with a strong presence in Israel, the U.S., and India 1 2.
🔍 Recent Highlights
JFrog is expanding its support for AI and ML artifacts, enhancing security in the software supply chain.
It recently partnered with Hugging Face and NVIDIA to improve AI model delivery and transparency 1.
Would you like a technical analysis, recent earnings breakdown, or investment outlook for FROG?
FROG trade ideas
$FROG - About to fly! 129% Upside potentialNASDAQ:FROG
As I've been calling out for the past month Tech Services and SaaS companies are the next phase of Ai and very hot right now based on the massive moves after meh to good earnings from the likes of NASDAQ:TEAM NASDAQ:MNDY NYSE:NET NASDAQ:CFLT
I believe this trend continues and this small 4B Mkt Cap company could really get going after earnings on Thursday!
- CupnHandle forming while Bull Flag breaking out
- Two year trendline is our safety net
- Massive Volume Shelf with GAP
- H5 Indicator made bullish cross and is GREEN
- WCB has formed
PTs: $43/ $57/ $67/ $84
NOT FINANCIAL ADVICE

Frogification & Fibonacci Retracements From SupportsSomething I like to do (although not as much as I want to) is approximate a support trendline in a clear uptrend, and obtain Fibonacci retracements from this support.
A non-arbitrary method is to return retracements from the support using a relevant swing high, the retracements will have the same angle as my support.
The chart above shows an instance of this method in a prior trend on FROG. Notice how each retracement starts at the same x1 coordinate.
We can skew our retracement starting point such that the retracement with ratio = 1 starts at the coordinate of our reference swing.
This method is also valid and will tend to return more spaced retracements. Here is how this approach looks for our current chart.
Price position relative to our retracements could indicate the possibility for an upward bounce.
Keep on frogin.

I Am So So Frog I have seen some of you claim for a pre-cup on FROG 15m! Indeed It hasn't been unnoticed.
I shall remind you that a high degree of variation around a "cup" lowers its validity, what might you say to this?
Assuming we have a model y representing our underlying trend, the degree of variation around our fitted model can be given by the sum of squared error (SSE):
se = (price - y ) ^ 2
sse = SUM(se)
A cup alone makes the assumption of a quadratic underlying trend (that is if you remove cyclical and noisy variations from the price you end up with a curve looking like a parabola) given by:
price(t) = at^2 + bt + c + cycle(t) + noise(t)
where at^2 + bt + c is the quadratic trend, where a , b , and c are constants.
If the amplitude of the cycle(t) and noise(t) components are high then variability around the trend will be higher.
You might see cups everywhere, and that's cool, it's very open-minded of you, and you might even be right, however, trends buried in noise are not as pertinent if you truly believe they play a key role in your analysis.

5/9/24 - $frog - jump before u get boiled here. down > up5/9/24 - vrockstar - i genuinely don't think there's a valuation we'll agree that's ownable toward where the stock is parked. 60c this year on 50x? $30 stock. "yes" but look at that EPS growth, it's 100% yoy... yes but it's 70c the following year and trust me it's probably not going to cagr 50%. if it does... pls comment below. 8x sales for mid teens to 20% growth? this looks like the setup of nearly every other b2b name that's getting murdered on any indication of a bad guide. i'm going to short this one. gl to the owners. dump and run now while you can is my advice. if does beat, i'd ditch it immediately. you can do a lot better on larger cash gen names that yield MSD returns. w/ this one you're staring at 1-2% fcf yield at best at these levels. no bueno.

FROG 2024-03-19 looks like want to jump higherNASDAQ:FROG looks bullish
- good revenue growth & cashflow
- consolidate tightly for a while
- it depends on FED meeting this week, but it looks like it's ready to go higher
- Could be a good entry with low-risk (tight stoploss < 5%)

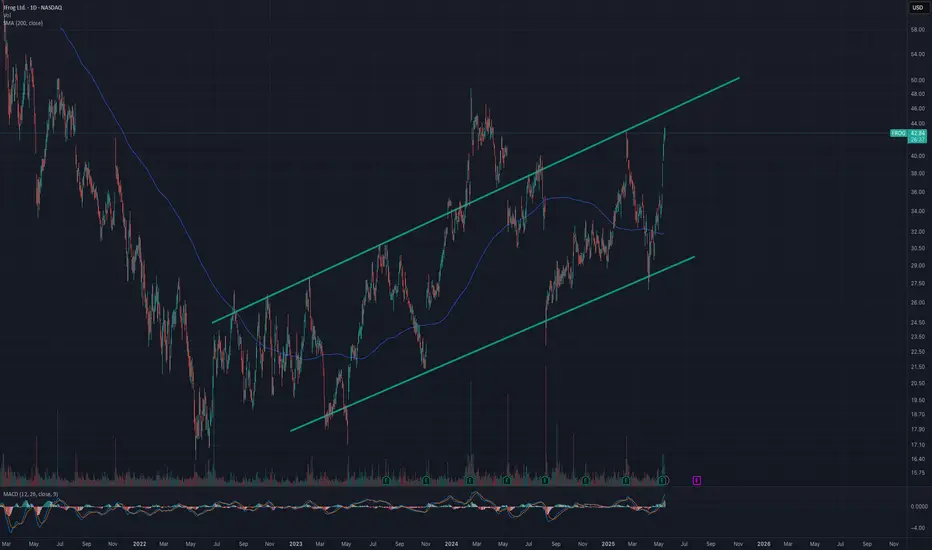
Bullish Parallel Channel??! Trade the channel!Beautiful consistent bullish parallel channel.
0% debt company, primed for growth.
Beautiful buying opportunity once it reaches the bottom of the channel.
Please use proper risk management.
Thanks!

$FROG Breaking out of PEG Pennant?I have been watching NASDAQ:FROG since the Power Earnings Gap on Nov 2nd. It pulled in nicely and I should have bought it on Nov 13, but I missed it. It has since pulled back again and looks to be breaking out of this consolidation area.
I have started a ¼ size position with a stop below today’s low. I will look to add if it can follow thru without stopping me out this week. All TBD.
They did miss on earnings but beat on revenue. Although they missed, the earnings growth was 47.4% and revenue grew by 23.1%
Ideas, not investing / trading advice. Comments always welcome. Thanks for looking.
From earningswhispers.com :
JFrog Missed Consensus Estimates
Wednesday, November 1, 2023 at 4:07 PM ET
JFrog (FROG) reported a loss of $0.10 per share on revenue of $88.64 million for the third quarter ended September 2023. The consensus estimate was a loss of $0.08 per share on revenue of $87.56 million. The company missed consensus estimates by 25.00% while revenue grew 23.12% on a year-over-year basis.
The company said it expects fourth quarter non-GAAP earnings of $0.12 to $0.13 per share on revenue of $92.50 million to $93.50 million. The current consensus earnings estimate is $0.08 per share on revenue of $92.93 million for the quarter ending December 31, 2023.
JFrog, the creator of the DevOps platform, is on a “Liquid Software” mission to enable the flow of software seamlessly and securely from the developer’s keystrokes to production.

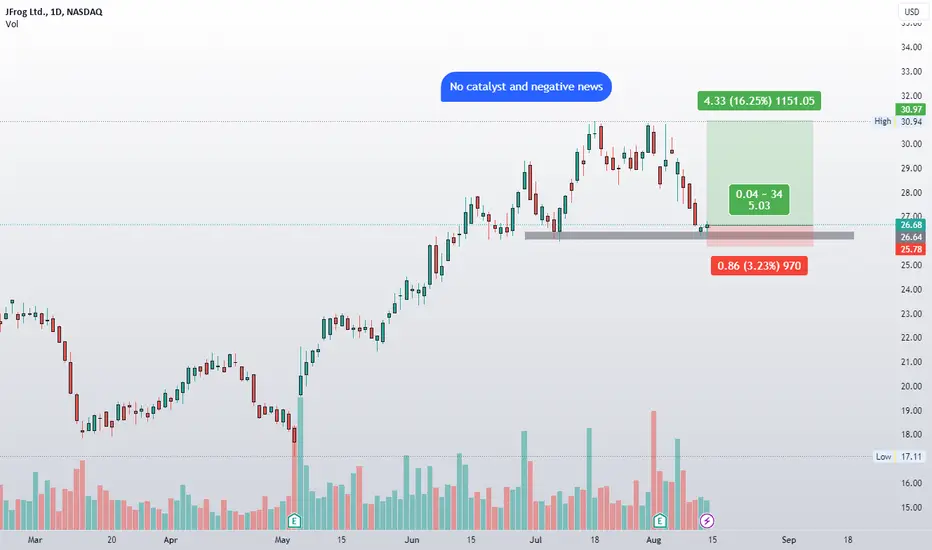
$FROG - Strong SUPPORT, Potential BUY playFundamental analysis:
NASDAQ:FROG reported earnings of $0.04 per share on revenue of $84.17 million for the second quarter ended June 2023. The consensus earnings estimate was $0.05 per share on revenue of $82.96 million. The revenue grew 24% year on year.
Technical analysis:
Strong support @ $26.
Company description:
JFrog Ltd operates as a software development company. Its products are available as open-source, self-managed, SaaS services on AWS, Microsoft Azure and Google Cloud.
Weekly chart on $FROG is primeNASDAQ:FROG
Weekly chart on NASDAQ:FROG looks ideal for a good move above $29. Options are almost non existent. So will have to go in with stock buy if clears buy point. Good fundamentals too.

Breakout Trade in FROGJFrog is a supply chain software company out of California.
This mid-cap stock formed a base over the last twelve months and is now trying to break out on above average volume.
The run up from $17 to $28 took place on good volume, so this looks like accumulation on the institutional side.
I think this is buyable here. A couple weeks of tight price action near the $28 level to absorb overhead supply would make this trade even more appealing.

JFrog Attempting Breakout of Downtrend.We have a Monthly Downtrend that Looks to be showing signs of weakness as well as two Monthly Doji Candles below; If we can get a decent earnings report tormorrow i'd expect that we can see JFrog move up fast into the 61.8% Retracement area.

18-11-21 FROG Ready to JumpPivots, trendlines, MAs all lining up on a reversal confirmed during a weak market day yesterday.
70 USD in some months.

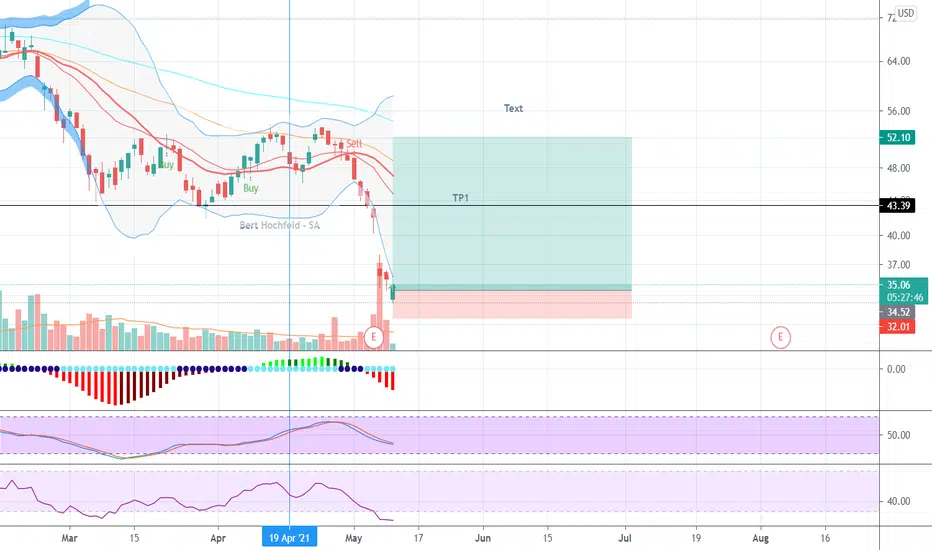
The FROG is looking bullish (2)So, the FROG did made a move to
the upside and now is correcting a bit. (with the general market). A good entry is in the green box area. But be patient, if the general market is still going down the FROG will follow.

The FROG is looking Bullish Hello Friends. All details are on the chart,
As you can see jfrog broke out of the channel and now making a retest on the upper lip of it.
If it holds that's a good sign for bulls.
The rsi on the weekly shows a bullish divergence.
I'll be watching and monitoring the chart for more information toward next week.
*not financial advice


Bullish Bat Entry on Potential Double Bottom.Lets see if we can get a double bottom from here. The MACD Looks ready to cross bullishly.

This one looks like it wanna break-outHuge volume , EMA cross and no rejection.
This looks very bullish to me, there is a high chance for a breakout.
The only concerning sign is the RSI , it is almost overbought so be careful
Stop loss: under 47.47
Next resistance: 57.47

6/15 FROGit's a re-post for FROG
after out of the downtrend zone, let's wait FROG to consolidate for a while before rallying up


6/5 FROG(1) this is not a quick action trade for Frog which I feel already late to swing on it for now
(2) do keep eyes on it and I expect the pink zone as a consolidation after FROG gets out of the downtrend first
(3) then we would enter a patient play for it

JFROG - Will the Frog Turn Green ?Short Term chart
Developing Crab Pattern. Let a bottom form first
Crab Patterns may Extend as much as 1.92 times XA
Stop and Targets are marked
As always do your own due diligence
Good Luck
S

FROG - LongAs per Chart
Scaling into this as it is a counter trend trade
Earning were a beat however analysts cut targets and future guidance suggests they may miss full year revenue (198 -204m vs 202m from the street)
One potential issue is that the beat came in part from price hikes suggesting that sales volume may be fading?