FSLR BUY OR LONG, TARGET $100 FSLR Counterattacked by bullish counter pressure with GAP/UP, I love this response and will buy it.
The initial target is the old $100 resistance but I believe it is worth $150 by the end of 2021.
Don't forget to set a reasonable stop loss.
FSLR trade ideas


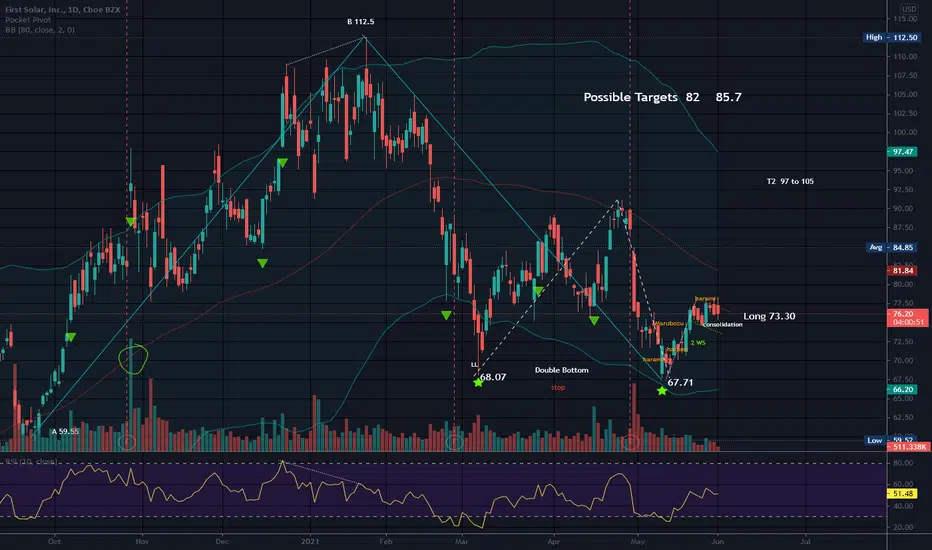
Double BottomPossible stop below the lower of the 2 bottoms or the last pivot low. I often place stops under horizontal trading zones which are areas of consolidation. The longer these zones, are the better.
A double bottom can show the bears where the bulls are willing to make a stand. This can give confidence to the bulls and can make bears a bit less confident.
Possible small flag forming.
A Marubozu is a taller candle with no shadows, or wicks on the top or the bottom. This one is red, but there is also a green Marubozu candle. As a rule these candle may affect price on a very short basis and are a signal that continuation of the current trend may persist.
No recommendation
Can be a good idea to listen carefully to what the market is willing to give you, but you can't force the market to give you anything.
First Solar D1First Solar is the largest manufacturer of solar panels. The last year was quite successful for the company, and brought the company's shares to a historical maximum. Currently, the world is experiencing a boom in alternative energy sources. Electricity prices are rising, forcing many to purchase solar systems. The beginning of the summer season gives good prospects for earning money for companies producing solar systems. This direction is developing more and more actively every year and gives more and more profits. The company's huge cash registers are a good stimulus for the growth of stocks. The coronavirus situation has forced many to move to the province. Which can create an increased demand for solar panels. Therefore, this year may give even more serious prospects for First Solar.

First Solar D1First Solar is the largest manufacturer of solar panels. The last year was quite successful for the company, and brought the company's shares to a historical maximum. Currently, the world is experiencing a boom in alternative energy sources. Electricity prices are rising, forcing many to purchase solar systems. The beginning of the summer season gives good prospects for earning money for companies producing solar systems. This direction is developing more and more actively every year and gives more and more profits. The company's huge cash registers are a good stimulus for the growth of stocks. The coronavirus situation has forced many to move to the province. Which can create an increased demand for solar panels. Therefore, this year may give even more serious prospects for First Solar.


ABC Bullish Earnings 4-29 AMCEarnings 4-29 after market close.
Stop under C or last strong source of support.
No recommendation


FSLR Technical AnalysisAn example of a head-and-shoulders bottom chart pattern can be expected on the graph. Follow price for a breakout on the neck.

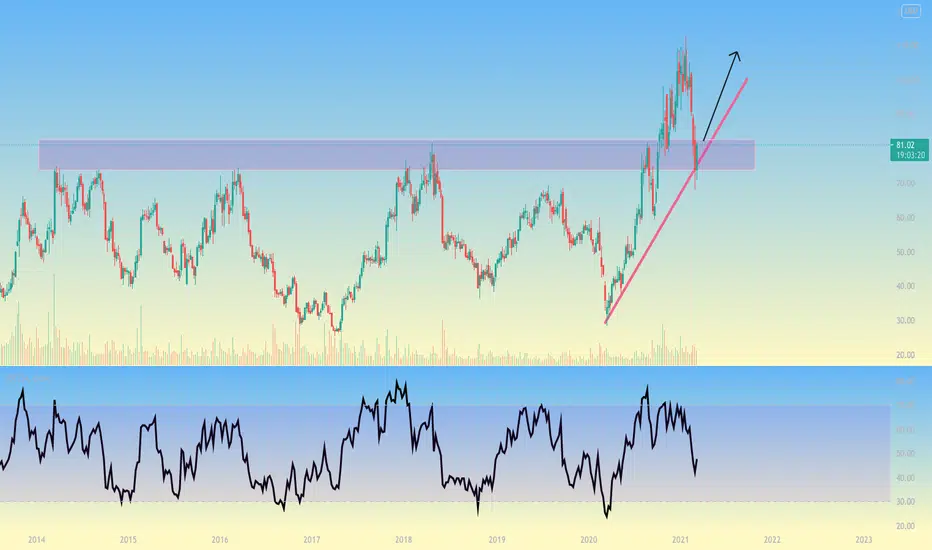
Starting to build supportStarting to notice a trend on solar stocks, building support along trend lines and MACD is starting to flatten out on weekly view, indicating a reversal pretty soon. These were the first to start underperforming when people went to value stocks.

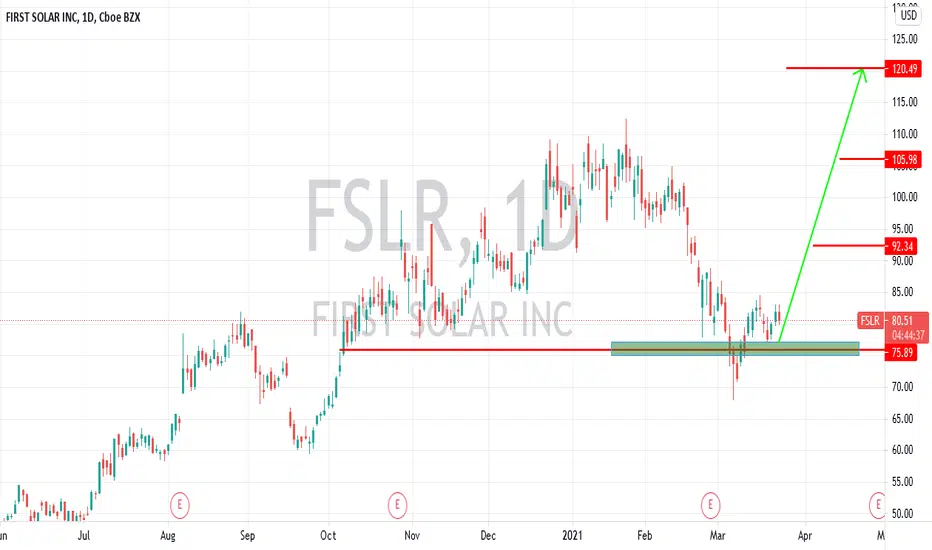

April price target 100 previous resistance is trying to turn into support here if 85 breaks and holds we can see a break past 100 soon! great chart. i know a lot of you are in, so goodluck! not a bad time to enter in my opinion
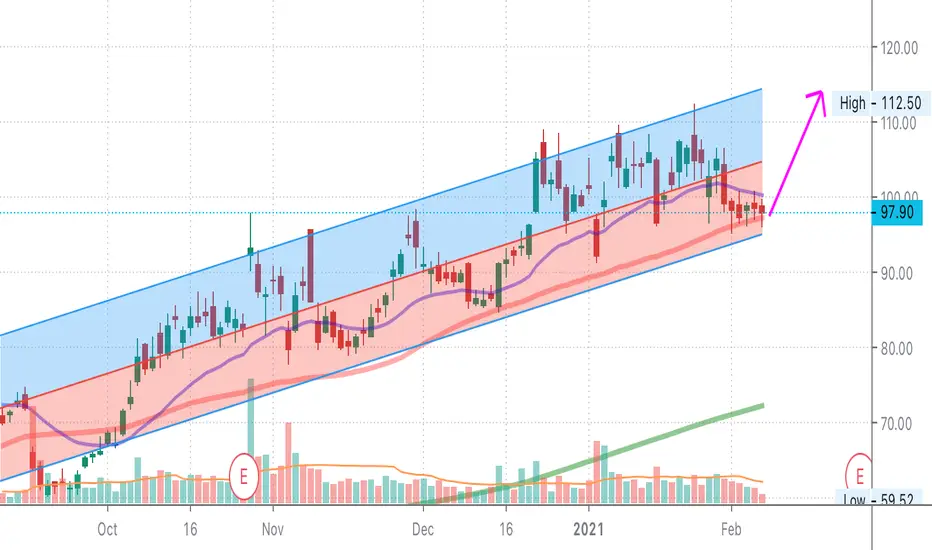
$FSLR 2/21$FSLR - Found resistance at 100EMA after rotation out of solar stocks this past week. Low on RSI. Ready for a bounce.

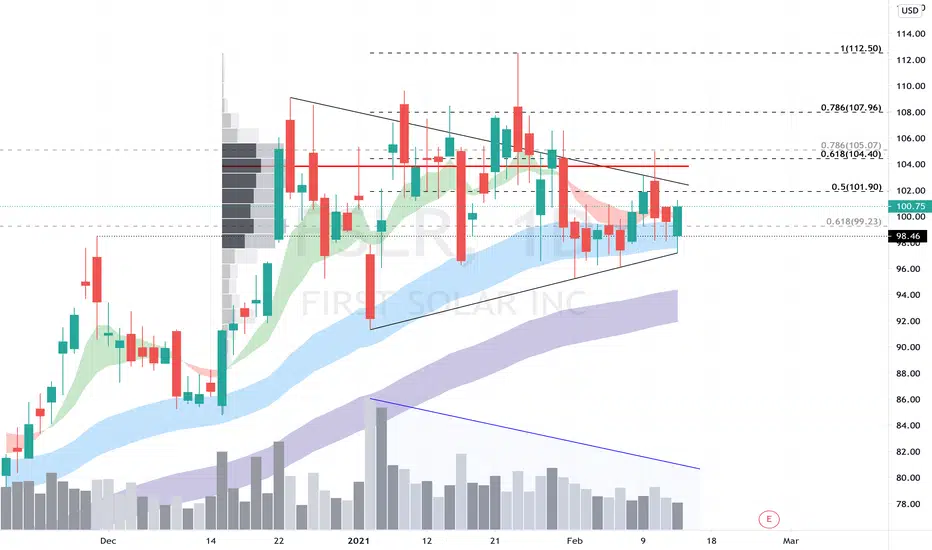
FSLR over 105.00Symmetrical triangle forming on declining volume showing consolidation. This has some work to do to break and hold the VPOC (red line) and recent highs. But a strong mover when it goes, solar looks set up, and this could run up into earnings on 2/25
$FSLR rebounding off of resistance, could go up to 115FSLR has been consistently rebounding off the resitance line, and is starting to do the same now, potential for hitting 115

FSLR Potential to hit supportsfrom the history of fslr, it looks as thought it has a shot of hitting supports of up to $115