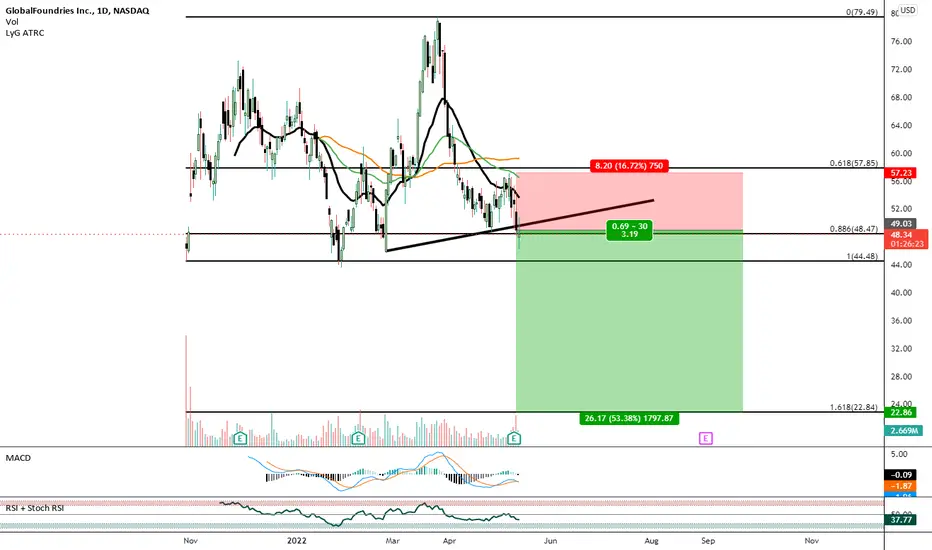
Support and resistanceThe stock is now at support. Share movements in the stock market are not everything. The company has an important influence but I trust the company and that's why we can look at the analysis. I believe it will go from support to the top of the decline channel and I believe it is at least 30%. Also macd and rsi is looking good.
GFS trade ideas

GFS is BullishPrice was in a strong downtrend, however now the bullish RSI divergence seems to playing out, as the trendline is broken successfully followed by a higher high, which according to Dow theory marks the beginning of a bullish rally. Targets are mentioned on the chart.

GlobalFoundries (GFS) gains amid TSMC challengesGlobalFoundries Inc. (NASDAQ: GFS) saw its stock climb nearly 7% on Thursday, bucking the downtrend affecting other key players in the semiconductor industry. This increase came amid potential new US restrictions on chip supplies to China, which could negatively impact major competitors like Taiwan Semiconductor Manufacturing Company Limited (TSMC) and NVIDIA Corp. These potential restrictions, stemming from the administration of US President Joe Biden, could limit TSMC and NVIDIA’s business operations in China, creating an advantageous position for GlobalFoundries.
Despite having approximately half the gross margin of TSMC, GlobalFoundries might benefit significantly from these geopolitical shifts. If competitors face restrictions, GlobalFoundries could leverage the situation to raise prices and improve its margins, potentially altering its competitive standing.
Technical analysis of GlobalFoundries Inc. (NASDAQ: GFS)
Reviewing the stock’s current technical setup offers insights into potential trading strategies:
Timeframe : Daily (D1)
Current trend : the stock recently broke through the resistance level at 55.25 USD and is attempting to establish new support at 54.00 USD
Resistance line : previously at 55.25 USD, now potentially acting as support
Potential downtrend target : if the downtrend resumes, the downside target might be set at 49.50 USD
Short-term target : If the uptrend continues, a short-term target could be set at 68.00 USD following a rebound from the new support level
Medium-term target : with sustained positive momentum, the stock price might target 79.00 USD
Investors should closely monitor GlobalFoundries’ performance, particularly as the geopolitical landscape evolves. The company’s ability to capitalise on restrictions its competitors face could significantly influence its market position and stock performance.
—
Ideas and other content presented on this page should not be considered as guidance for trading or an investment advice. RoboMarkets bears no responsibility for trading results based on trading opinions described in these analytical reviews.
The material presented and the information contained herein is for information purposes only and in no way should be considered as the provision of investment advice for the purposes of Investment Firms Law L. 87(I)/2017 of the Republic of Cyprus or any other form of personal advice or recommendation, which relates to certain types of transactions with certain types of financial instruments.
Risk Warning: CFDs are complex instruments and come with a high risk of losing money rapidly due to leverage. 65.68% of retail investor accounts lose money when trading CFDs with this provider. You should consider whether you understand how CFDs work and whether you can afford to take the high risk of losing your money.

GlobalFoundries Spike 9.4% as Income Nearly Doubles ExpectationGlobalFoundries ( NASDAQ:GFS ) has surpassed Wall Street's first-quarter earnings targets and provided better-than-expected guidance for the current period. The Malta-based company earned an adjusted 31 cents a share on sales of $1.55 billion in the March quarter, which was 40% below analysts' expectations of 23 cents a share on sales of $1.52 billion. However, on a year-over-year basis, GlobalFoundries ( NASDAQ:GFS ) earnings declined 40% while sales fell 16%.
For the current quarter, NASDAQ:GFS expects to earn an adjusted 29 cents a share on sales of $1.615 billion, based on the midpoint of its guidance. Wall Street was modeling for earnings of 29 cents a share on sales of $1.58 billion in the second quarter. In the year-earlier period, GlobalFoundries ( NASDAQ:GFS ) earned an adjusted 53 cents a share on sales of $1.845 billion.
GlobalFoundries ( NASDAQ:GFS ) is navigating a cyclical downturn in business from fabless chipmakers exposed to the automotive and industrial markets. The company's Chief Executive, Thomas Caulfield, said that as pockets of the semiconductor industry begin to emerge from the inventory correction, their teams are driving foundry innovation and differentiation for customers across their essential end markets.
Shares of semiconductor manufacturer GlobalFoundries ( NASDAQ:GFS ) surged after markets opened Tuesday following the release of a first-quarter earnings report that included income nearly doubling analyst expectations. However, GlobalFoundries' financial performance fell year-over-year as the semiconductor market has corrected. The company was also one of the beneficiaries of the CHIPS Act, receiving a $1.5 billion grant from the Biden administration earlier this year to expand its operations in New York and Vermont.
Technical Outlook
GlobalFoundries ( NASDAQ:GFS ) Stock is up 7.74% at the time of writing trading with a Relative Strength Index (RSI) of 65.47. The stock is slightly overbought.

GFS ready for breakout based on chart, news, and EPS reportChart is posted.
Beat EPS and announced $1.5 billion government deal to produce micro chips in US.

GLOBAL FOUNDRIES INC1. 2008: Advanced Micro Devices (AMD) announces a transition to a fabless model, focusing on chip design and leaving manufacturing to a new entity.
2. 2009: GlobalFoundries was born through a joint venture between AMD and Mubadala Investment Company, a sovereign wealth fund of the United Arab Emirates.
3. 2011: GlobalFoundries acquires Chartered Semiconductor Manufacturing, expanding its global footprint and technology portfolio.
4. 2015: The company purchases IBM's Microelectronics business, further solidifying its position as a major semiconductor foundry.
5. 2021: GlobalFoundries completes its Initial Public Offering (IPO), becoming a publicly traded company.
The company serves several economic sectors, its books are in good health, and the stock price is cheaper compared to its competitors.
We will be adding Global Foundries Inc to our portfolio.


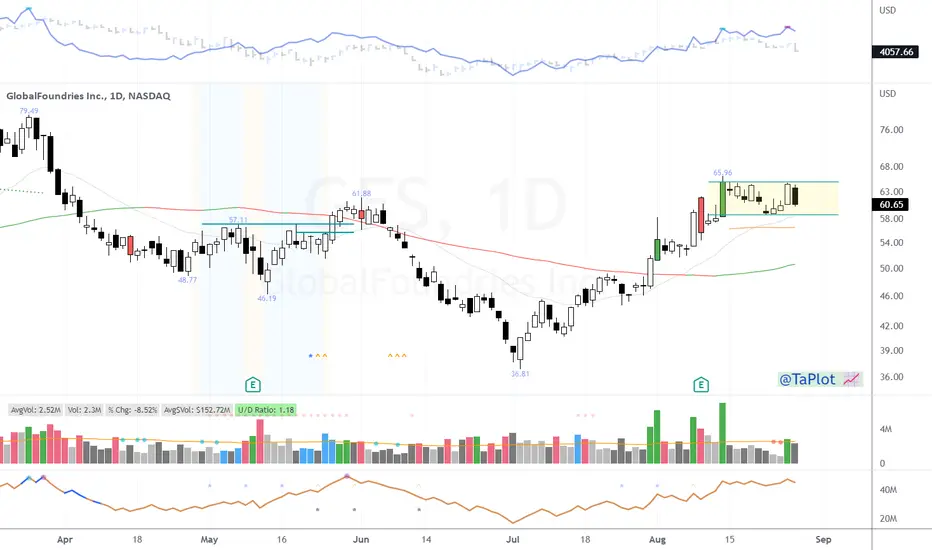
GFS: Potential BuyPrice has filled the gap from last week. I'm expecting the upside to continue towards 65 USD. Alternative entry would be around the lower trend lines if price gets there.

GLOBAL FOUNDRIES Stock Chart Fibonacci Analysis 072723 Trading Idea
1) Find a FIBO slingshot
2) Check FIBO 61.80% level
3) Entry Point > 60.3/61.80%
Chart time frame : B
A) 15 min(1W-3M)
B) 1 hr(3M-6M)
C) 4 hr(6M-1year)
D) 1 day(1-3years)
Stock progress : C
A) Keep rising over 61.80% resistance
B) 61.80% resistance
C) Hit the bottom
D) Hit the top
Stocks rise as they rise from support and fall from resistance. Our goal is to find a low support point and enter. It can be referred to as buying at the pullback point. The pullback point can be found with a Fibonacci extension of 61.80%. This is a step to find entry level. 1) Find a triangle (Fibonacci Speed Fan Line) that connects the high (resistance) and low (support) points of the stock in progress, where it is continuously expressed as a Slingshot, 2) and create a Fibonacci extension level for the first rising wave from the start point of slingshot pattern.
When the current price goes over 61.80% level , that can be a good entry point, especially if the SMA 100 and 200 curves are gathered together at 61.80%, it is a very good entry point.
As a great help, tradingview provide these Fibonacci speed fan lines and extension levels with ease. So if you use the Fibonacci fan line, the extension level, and the SMA 100/200 curve well, you can find an entry point for the stock market. At least you have to enter at this low point to avoid trading failure, and if you are skilled at entering this low point, with fibonacci6180 technique, your reading skill to chart will be greatly improved.
If you want to do day trading, please set the time frame to 5 minutes or 15 minutes, and you will see many of the low point of rising stocks.
If want to prefer long term range trading, you can set the time frame to 1 hr or 1 day.

GFS 3 Drives to a TOP SHORTGFS is forming a Three Drives to a Top pattern in the Daily just at the same spot of the 0.618 retracement of the previous swing.
I am inputting an order to sell short at 65.43$ with a 0.75$ stop loss.

Global Foundries Bearish Shark Global foundries shows a harmonic shark pattern with a Close below 61.14 activating T1 target @ $54.75
Break the 0.382 fib zone at the sloping trendline activates T2 target @ $48.40
T1 target @ $54.75
T2 target @ $48.40

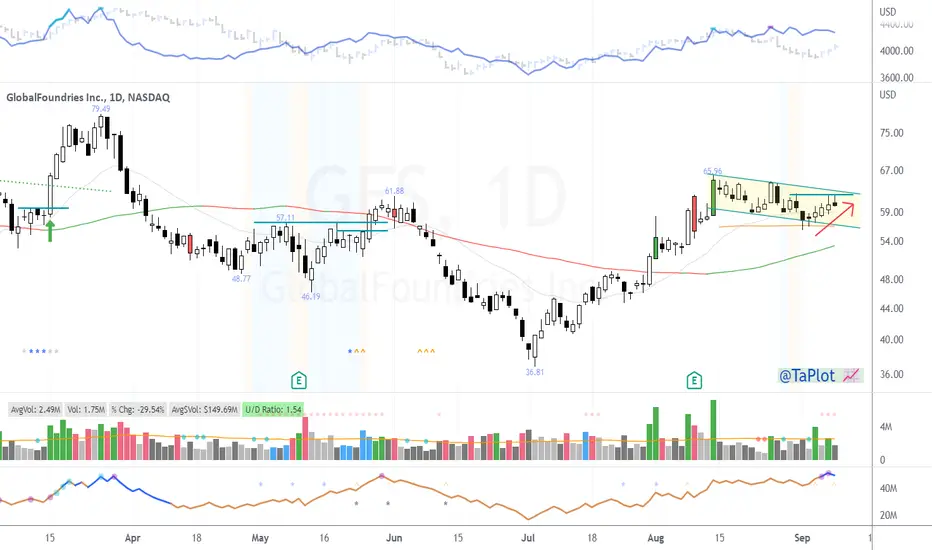
Potential 25% Swing on GFSTechnicals:
GFS is in an ascending channel
Has just had a reversal off the channel support line
Reversal confirmed by crossover above lower line of regression channel
There's around 30% upside to the resistance line of the channel.
I will play this situation with a short-term, long swing trade. My profit target is ~25%, at 71.39, with a risk/reward of 3.29 and stop loss right below the swing low, at 52.61

GLOBAL FOUNDRIES Stock Chart Fibonacci Analysis 042823Trading Idea
1) Find a FIBO slingshot
2) Check FIBO 61.80% level
3) Entry Point > 59/61.80%

GFS - Could have started a third wave higher towards 75$+I bought this one yesterday with a Stop at 60.5$
If you want to get in, maybe wait for a small intraday pullback before doing so if you consider that a 6% risk is too much for you in current market conditions.

Pullback Buy in this IPOGFS is a young IPO that has finally formed its first proper base. The weekly chart shows tons of accumulation and a strong volume profile. This broke out of a 13-week 29% deep cup base and now has a tight weekly close. I will be watching this to hopefully pullback to the 21 ema. It may not happen, but if it does, I will be ready to pounce

$GFS Correcting Wedging Action$GFS did the right thing on Friday and needs to weaken a bit here to correct that wedging price action.
Still top dog on my list. Just wanting for the right price action/moment.
$GFS Continue to Setupvolume pattern on $GFS is just beautiful.
Price action needs some work so crossing fingers from some quiet movement tomorrow that puts it in a better shape for early next week.

$GFS Still Looking GoodA potential leader that is still looking good post Friday sell off.
Consolidating sideways and worth watching heading into next week.
MACD Bearish Convergence Below Demand Line on GlobalFoundriesI have bought the Quarterly PUTs on this as i believe it is due for a 1.618 Retracement after it breaks through it's last support levels.
GFS below 45 during 20 May OptionPlease find my humour style of technical chart.
1. From what I foresee, this week will go up and higher prior to the financial report release.
After that, the prices are likely to start dipping to before 45 on 20th May.
2. Alternatively, the price will start to go down, 1st May onwards will go up till 10th May.
After that, the prices are likely to start dipping to before 45 on 20th May.

3/27/22 GFSGlobalFoundries Inc. ( NASDAQ:GFS )
Sector: Electronic Technology (Semiconductors)
Market Capitalization: $42.208B
Current Price: $78.94
Breakout Price (hold above): $77.05
Buy Zone (Top/Bottom Range): $74.35-$67.40
Price Target: $90.20-$91.60
Estimated Duration to Target: 40-43d
Contract of Interest: $GFS 5/20/22 80c
Trade price as of publish date: $7.80/contract

GFS - breaking outIt is looking strong today, on the overall weak day after inflation report
Already up 5%
I think, it's only the beginning of the move after strong earnings and analysts upgrades.
MACD and RSI are also confirming the move
We'll see

GFS upward channel 12/22/21It appears GFS might be possibly building right underneath the upward channel, looking for a move in the near term for it to reclaim the upward channel .
Not financial advice
