GIGM DCA - Cup and Handle PatternCompany: GigaMedia Limited
Ticker: GIGM
Exchange: NASDAQ
Sector: Technology
Introduction:
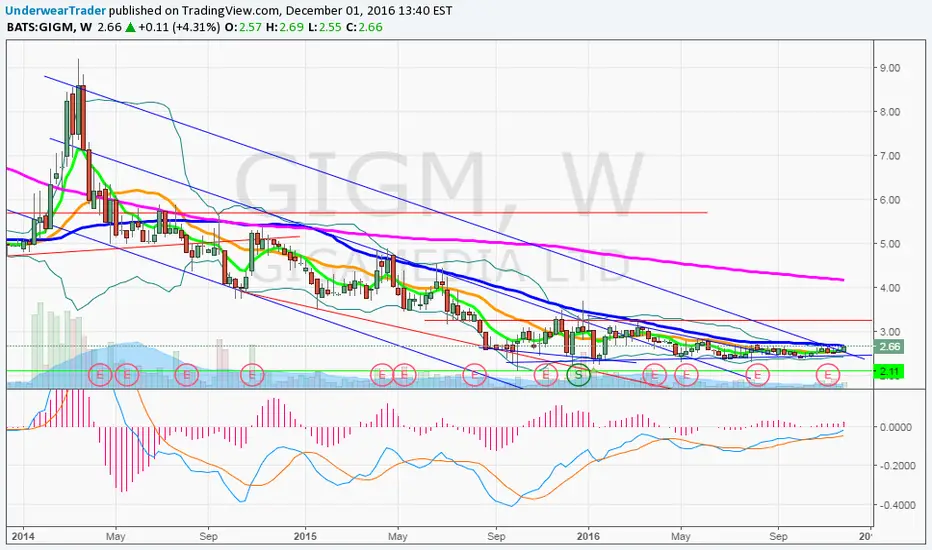
Hello everyone, today we are focusing on GigaMedia Limited (GIGM), analyzing its Daily scale chart on the NASDAQ exchange. The price chart has caught our attention due to the formation of a bottom pattern, specifically, a cup and handle, which has been developing over the past 270 days.
Cup and Handle Pattern:
The cup and handle pattern is typically a bullish reversal pattern signifying a period of consolidation followed by a breakout. As the name suggests, it resembles a cup with a handle.
Analysis:
GigaMedia's price chart has been in a downtrend, as indicated by the blue diagonal resistance line. However, the formation of a cup and handle pattern suggests a potential reversal of this trend. The price is currently attempting to surpass the 200 EMA, and the horizontal resistance stands at $1.62.
If a breakout above this resistance level occurs, a long position could be considered. Our projected price target in this case would be $2.12, which corresponds to a potential price increase of approximately 30.74%.
Conclusion:
The daily chart for GigaMedia Limited suggests a potential bottom reversal with the formation of a cup and handle pattern. A breakout above the pattern's resistance could present a viable long position opportunity.
As always, remember to conduct your own research and consider your risk management strategies before making investment decisions.
Thank you for tuning into this analysis. If you found it informative, please like, share, and follow for more updates. Happy trading!
Best regards,
Karim Subhieh
GIGM trade ideas

Falling Channel (USA Stock Reference)USA Stock Analysis: Gigamedia has broken the falling channel and supply zone with high volume, As long as price stays above the demand zone expected to reach the target mentioned on the chart. let's see
Happy Investing!

Silly graph of: GIGMI have been a long-time bagholder of this zombie, and it is starting to blink.
Recently inside trades last years.
Trades below book value.
Starting to operate within the RaaS industry.

Large insider buy by CEO - 7.5% target / 10% stop lossAverage volatility, last time when CEO bought big (December 2017) stock jumped nearly 50%

Big spike Volume Also known like unusual volume is a traditional way to pick stocks because something is happening here, somebody have a big interest here and he or they bought a big quantity of shares the same day and this generally drives the price up.
Other aspect to take into account is
Shares Outstanding: 11.05 Mil
Float: 8.22 Mil
Mean Volume: 84,972
This info is relevant for big investors because this tells they how liquid is this market and it has a great effect in the spread of the stock
Note: I do not publish or share Penny Stocks ideas
This company is a small cap listed in the NASDAQ 19 years ago but is not a penny stock or Over-The-Counter stock
Industry: Multimedia & Graphics Software
Sector: Technology
The stock of this company fell for several years and now the price is showing strength accompanied with a high volume. That is all
With respect to technical analysis: Patience because this is not 15 Min Chart and this take more time
Concepts
www.investopedia.com
www.investopedia.com
www.investopedia.com
www.investopedia.com


GIGM Potential double bottom recent RS and CEO purchasesGIGM insider purchases post Reverse Split.
20MA about to cross 50MA. Potential double bottom formation and trading out of channel
$3.80 price target by March and $4.50 potential
Stop loss below $3.00. Low float so can move fast either direction

GIGM 11/3/13Type of trade: Day/Swing
PT: 1.09
SS: .98
Follow me at Twitter: @jimmyjgo
Stocktwits: @Jgo
GLHT
*Keep an eye on mace tom for the continuation move to the upside…
(Above cloud finally)
Ichimoku crossover(Bullish)+MACD Bullish Hold=BULL..lol
