GNOM Long 6/23/24Looking Higher in wave (iii) of {iii} through at least 12.53 against the wave {ii} low of 9.57.
Key stats
About Global X Genomics & Biotechnology ETF
Home page
Inception date
Apr 5, 2019
Structure
Open-Ended Fund
Replication method
Physical
Dividend treatment
Distributes
Distribution tax treatment
Qualified dividends
Income tax type
Capital Gains
Max ST capital gains rate
39.60%
Max LT capital gains rate
20.00%
Primary advisor
Global X Management Co. LLC
Distributor
SEI Investments Distribution Co.
GNOM is Global Xs take on biotech, with more of an emphasis on genomics specifically. The fund fleshes out its description of this sector by including companies that derive more than 50% of their revenues from the following five business activities: (i) gene editing, (ii) genomic sequencing, (iii) development and testing of genetic medicine/therapies, (iv) computational genomics and genetic diagnostics, and/or (v) biotechnology. The fund uses a proprietary natural language processing algorithm to identify and rank eligible firms based on public documents, such as filings and disclosures. Holdings may span the market-cap spectrum and come from across the globe, including some emerging markets. The market-cap-weighted index is reconstituted and rebalanced semi-annually.
Related funds
Classification
What's in the fund
Exposure type
Health Technology
Health Services
Stock breakdown by region
Top 10 holdings

GNOM A Good ETF that Captures the Genome & Biotech RevolutionBiotech in my opinion will be the biggest sector of growth in the 21st Century. Lot of value here in this ETF and it has the potential to explode in growth for a long time. Other good ETFs for this sector are ARKG IBB XBI. New highs in the next few years is my call on GNOM

$GNOM Went slightly lower than the double bottom and bounced.Medium bounce here, prbly not expecting much more from this one.
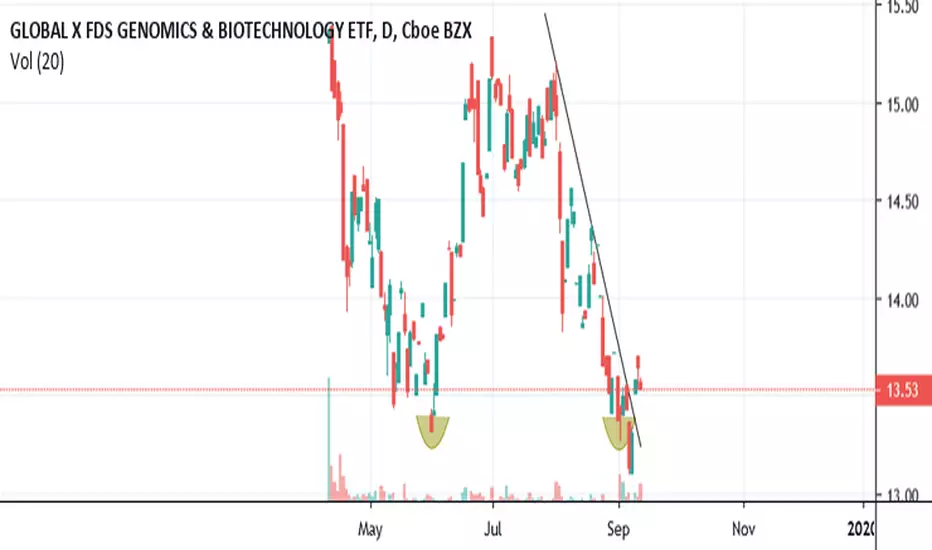
$GNOM A bit of buying at that bottom hammer, watching for popNeeds to break above that trend line, possible double bottom with that last hammer.

$GNOM Bounced from wedge, and failed from top doji.Too much selling after the wedge break, and broke down.
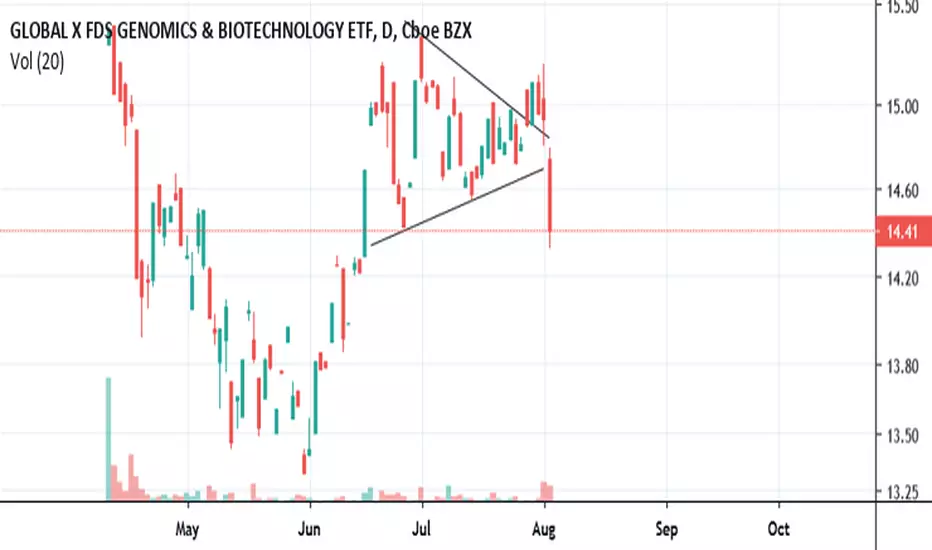
$GNOM Looks ready to bounce here.Tightening wedge along with some buy volume toward the end, looking for a upward push.

See all ideas
Summarizing what the indicators are suggesting.
Oscillators
Neutral
SellBuy
Strong sellStrong buy
Strong sellSellNeutralBuyStrong buy
Oscillators
Neutral
SellBuy
Strong sellStrong buy
Strong sellSellNeutralBuyStrong buy
Summary
Neutral
SellBuy
Strong sellStrong buy
Strong sellSellNeutralBuyStrong buy
Summary
Neutral
SellBuy
Strong sellStrong buy
Strong sellSellNeutralBuyStrong buy
Summary
Neutral
SellBuy
Strong sellStrong buy
Strong sellSellNeutralBuyStrong buy
Moving Averages
Neutral
SellBuy
Strong sellStrong buy
Strong sellSellNeutralBuyStrong buy
Moving Averages
Neutral
SellBuy
Strong sellStrong buy
Strong sellSellNeutralBuyStrong buy
Displays a symbol's price movements over previous years to identify recurring trends.
Frequently Asked Questions
An exchange-traded fund (ETF) is a collection of assets (stocks, bonds, commodities, etc.) that track an underlying index and can be bought on an exchange like individual stocks.
GNOM trades at 8.64 USD today, its price has fallen −0.99% in the past 24 hours. Track more dynamics on GNOM price chart.
GNOM net asset value is 8.64 today — it's risen 4.83% over the past month. NAV represents the total value of the fund's assets less liabilities and serves as a gauge of the fund's performance.
GNOM assets under management is 43.79 M USD. AUM is an important metric as it reflects the fund's size and can serve as a gauge of how successful the fund is in attracting investors, which, in its turn, can influence decision-making.
GNOM price has risen by 5.69% over the last month, and its yearly performance shows a −25.37% decrease. See more dynamics on GNOM price chart.
NAV returns, another gauge of an ETF dynamics, showed a 14.10% increase in three-month performance and has decreased by −25.31% in a year.
NAV returns, another gauge of an ETF dynamics, showed a 14.10% increase in three-month performance and has decreased by −25.31% in a year.
GNOM fund flows account for −20.99 M USD (1 year). Many traders use this metric to get insight into investors' sentiment and evaluate whether it's time to buy or sell the fund.
Since ETFs work like an individual stock, they can be bought and sold on exchanges (e.g. NASDAQ, NYSE, EURONEXT). As it happens with stocks, you need to select a brokerage to access trading. Explore our list of available brokers to find the one to help execute your strategies. Don't forget to do your research before getting to trading. Explore ETFs metrics in our ETF screener to find a reliable opportunity.
GNOM invests in stocks. See more details in our Analysis section.
GNOM expense ratio is 0.50%. It's an important metric for helping traders understand the fund's operating costs relative to assets and how expensive it would be to hold the fund.
No, GNOM isn't leveraged, meaning it doesn't use borrowings or financial derivatives to magnify the performance of the underlying assets or index it follows.
In some ways, ETFs are safe investments, but in a broader sense, they're not safer than any other asset, so it's crucial to analyze a fund before investing. But if your research gives a vague answer, you can always refer to technical analysis.
Today, GNOM technical analysis shows the buy rating and its 1-week rating is sell. Since market conditions are prone to changes, it's worth looking a bit further into the future — according to the 1-month rating GNOM shows the sell signal. See more of GNOM technicals for a more comprehensive analysis.
Today, GNOM technical analysis shows the buy rating and its 1-week rating is sell. Since market conditions are prone to changes, it's worth looking a bit further into the future — according to the 1-month rating GNOM shows the sell signal. See more of GNOM technicals for a more comprehensive analysis.
Yes, GNOM pays dividends to its holders with the dividend yield of 0.10%.
GNOM trades at a premium (0.06%).
Premium/discount to NAV expresses the difference between the ETF’s price and its NAV value. A positive percentage indicates a premium, meaning the ETF trades at a higher price than the calculated NAV. Conversely, a negative percentage indicates a discount, suggesting the ETF trades at a lower price than NAV.
Premium/discount to NAV expresses the difference between the ETF’s price and its NAV value. A positive percentage indicates a premium, meaning the ETF trades at a higher price than the calculated NAV. Conversely, a negative percentage indicates a discount, suggesting the ETF trades at a lower price than NAV.
GNOM shares are issued by Mirae Asset Global Investments Co., Ltd.
GNOM follows the Solactive Genomics Index. ETFs usually track some benchmark seeking to replicate its performance and guide asset selection and objectives.
The fund started trading on Apr 5, 2019.
The fund's management style is passive, meaning it's aiming to replicate the performance of the underlying index by holding assets in the same proportions as the index. The goal is to match the index's returns.