GRAL – Long Trade Setup !📈🟢
Ticker: GRAIL, Inc. (NASDAQ: GRAL)
Chart: 30-Min Timeframe
Pattern: Bullish pennant breakout with trend support
🔹 Entry: $37.28 (breakout + structure reclaim)
🔹 Stop-Loss: $36.00 (below trendline & support)
🔹 Take Profits:
TP1: $40.00 – Resistance zone
TP2: $40.76 – Measured move target
⚖️ Risk-Reward Calculation
– Risk per Share: $1.28
– Reward to TP2: $3.48
– R:R Ratio: ~1:2.7 ✅
🧠 Technical Highlights
– Strong uptrend from April 22nd
– Tight range breakout + volume confirmation
– Higher lows with bullish continuation signal
GRAL trade ideas

GRAL/USD – 30-Min Long Trade Setup !📌 🚀
🔹 Asset: GRAL (GRAIL, Inc.)
🔹 Timeframe: 30-Min Chart
🔹 Setup Type: Bullish Reversal Trade
📌 Trade Plan (Long Position)
✅ Entry Zone: Above $36.34 (Breakout Confirmation)
✅ Stop-Loss (SL): Below $33.58 (Invalidation Level)
🎯 Take Profit Targets:
📌 TP1: $40.53 (First Resistance Level)
📌 TP2: $45.53 (Extended Bullish Move)
📊 Risk-Reward Ratio Calculation
📉 Risk (SL Distance): $36.34 - $33.58 = $2.76 risk per share
📈 Reward to TP1: $40.53 - $36.34 = $4.19 (1:1.5 R/R)
📈 Reward to TP2: $45.53 - $36.34 = $9.19 (1:3.3 R/R)
🔍 Technical Analysis & Strategy
📌 Falling Wedge Breakout: Price has broken out of a falling wedge, a strong bullish reversal pattern.
📌 Support Rejection: The price tested $36.34 support and showed buying pressure.
📌 Volume Confirmation Needed: Ensure high buying volume when price holds above $36.34 to confirm bullish momentum.
📌 Momentum Shift Expected: If price remains above $36.34, it could push toward $40.53, and further to $45.53.
📊 Key Support & Resistance Levels
🟢 $33.58 – Stop-Loss / Support Level
🟡 $36.34 – Breakout Level / Long Entry
🔴 $40.53 – First Resistance / TP1
🔴 $45.53 – Final Target / TP2
📉 Trade Execution & Risk Management
📊 Volume Confirmation: Ensure high buying volume above $36.34 before entering.
📉 Trailing Stop Strategy: Move SL to entry ($36.34) after TP1 ($40.53) is hit.
💰 Partial Profit Booking Strategy:
✔ Take 50% profits at $40.53, let the rest run toward $45.53.
✔ Adjust Stop-Loss to Break-even ($36.34) after TP1 is reached.
⚠️ Fake Breakout Risk
❌ If the price fails to hold above $36.34 and drops back, exit early to avoid losses.
❌ Wait for a strong bullish candle close above $36.34 before entering aggressively.
🚀 Final Thoughts
✔ Bullish Setup – Bouncing from support at $36.34 suggests a potential reversal.
✔ Momentum Shift Possible – Watch for volume confirmation.
✔ Favorable Risk-Reward Ratio – 1:1.5 to TP1, 1:3.3 to TP2.
💡 Stick to the plan, manage risk, and trade smart! 🚀📈
🔗 #StockMarket 📉 #TradingNews 📰 #StockAnalysis 📊 #MarketUpdate 🔥 #Investing 💰 #Trading 📈 #Finance 💵 #ProfittoPath 🚀 #SwingTrading 🔄 #DayTrading ⚡ #StockTrader 💸 #TechnicalAnalysis 📉 #EconomicNews 🏛️ #FinancialFreedom 💡 #MarketTrends 📊 #StockAlerts 🔔 #TradeSmart 🤓 #Bullish 🐂 #RiskManagement ⚠️ #TradingCommunity 🤝

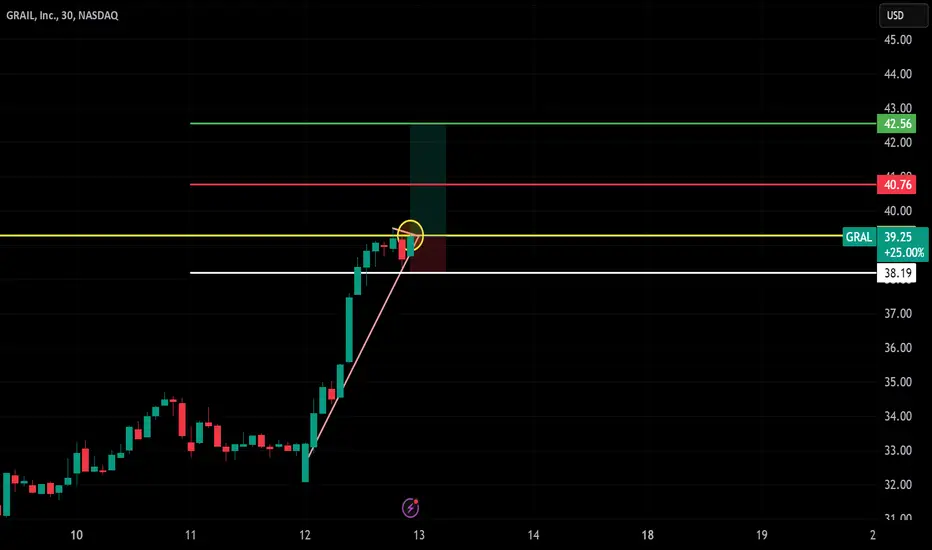
Long Trade Setup Breakdown for GRAIL, Inc. (GRAL) - 30-Min Chart📊
🔹 Asset: GRAIL, Inc. (GRAL)
🔹 Timeframe: 30-Min Chart
🔹 Setup Type: Bullish Momentum Breakout
🚀 Trade Plan (Long Position):
✅ Entry Zone: $39.25 (Breakout Confirmation)
✅ Stop-Loss (SL): $38.19 (Below Support)
🎯 Take Profit Targets (Long Trade):
📌 TP1: $40.76 (First Resistance)
📌 TP2: $42.56 (Extended Bullish Target)
📊 Risk-Reward Ratio Calculation:
📈 Risk (Stop-Loss Distance):
$39.25 - $38.19 = $1.06
📈 Reward to TP1:
$40.76 - $39.25 = $1.51
💰 Risk-Reward Ratio to TP1: 1:1.4
📈 Reward to TP2:
$42.56 - $39.25 = $3.31
💰 Risk-Reward Ratio to TP2: 1:3.1
🔍 Technical Analysis & Strategy:
📌 Breakout Confirmation: Strong buying momentum above $39.25 signals continuation.
📌 Pattern Formation: Bullish momentum breakout, suggesting an uptrend continuation.
📊 Key Support & Resistance Levels:
🟢 $38.19 (Strong Support / SL Level)
🟡 $39.25 (Breakout Zone / Entry)
🔴 $40.76 (First Profit Target / Resistance)
🟢 $42.56 (Final Target for Momentum Extension)
🚀 Momentum Shift Expected:
If price sustains above $39.25, it could push towards $40.76 and $42.56.
Higher volume breakout would confirm strength in the trend.
🔥 Trade Execution & Risk Management:
📊 Volume Confirmation: Ensure buying volume remains strong after breakout.
📈 Trailing Stop Strategy: If price reaches TP1 ($40.76), move SL to entry ($39.25) to lock in profits.
💰 Partial Profit Booking Strategy:
✔ Take 50% profits at $40.76, let the rest run to $42.56.
✔ Adjust Stop-Loss to Break-even ($39.25) after TP1 is hit.
⚠️ Fake Breakout Risk:
If price drops below $39.25 after breakout, be cautious and watch for a retest before re-entering.
🚀 Final Thoughts:
✔ Bullish Setup – If price holds above $39.25, higher targets are expected.
✔ Momentum Shift Possible – Watch for volume confirmation.
✔ Favorable Risk-Reward Ratio – 1:1.4 to TP1, 1:3.1 to TP2.
💡 Stick to the plan, manage risk, and trade smart! 🚀🏆
🔗 #StockTrading #GRAL #BreakoutTrade #TechnicalAnalysis #MarketTrends #DayTrading #ProfittoPath