Hasboro | HAS | Long at $66.00Hasboro $NASDAQ:HAS. Bouncing in an out of the historical simple moving average (SMA). While it may take a bit for it to spring out and continue its upward trend, it looks poised to do so. However, there is a small price gap that was never closed in the $40's that investors should stay cautious of if the downward trend continues. But a "confirmation" of a reversal will be either a continued move up or a retest of the lower historical SMA band (to close the recent price gaps) followed by a further move up. Fundamentally, NASDAQ:HAS has a high level of debt, but earnings growth is forecasted in its future. At $66.00, $ NASDAQ:HAS is in a personal buy zone, but patient investors may wish to wait for further confirmation of a reversal.
Target #1 = $73.00
Target #2 = $81.00
Target #3 = $87.00
Target #4 = $119.00 (very long-term...)
HAS trade ideas

Riding the Wave: Breakout Trading with Elliott Wave AnalysisHello Friends,
Welcome to RK_Chaarts,
Today we're going Analyze the chart of " HASBRO. " to identify a trend change opportunity.(Educational Post).
Let's get started!
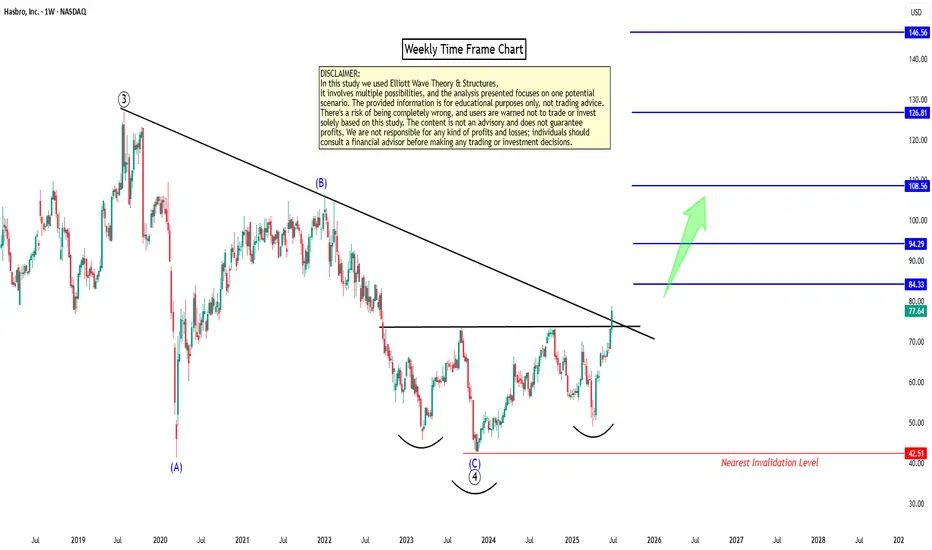
Today, we analyzed the weekly chart of "HASBRO" using Elliott Waves theory and chart patterns. We clearly observed that the July 2019 top, with a high of 126.87, completed a primary degree Wave ((3)) in Black. The recent bottom in November 2023, around 42.69, marked the end of primary degree Wave ((4)) in Black. Since then, the price has formed a higher high and low, indicating a potential reversal.
The recent weekly candle close has broken out of the Resistance trendline and also confirmed an inverted head and shoulders breakout along with good breakout in RSI on weekly-cum-monthly time frames. This suggests that we may be unfolding a primary degree Wave ((5)) in Black, which should consist of five sub-divisions of Intermidiete degree in Blue. Based on the chart, it appears that Intermidiete degree Waves (1) and (2) in Blue are complete, and Wave (3) may have started.
Resistance Trendline Breakout with Inverted Head n Shoulder Breakout
RSI Breakout on Weekly
RSI Breakout on Monthly
Major EMAs Support on Daily, Weekly & Monthly
Both Elliott Wave theory, EMAs support, Trendline Breakout and chart pattern Breakout indicates that the price is likely to move higher from here. However, please note that technical analysis is a game of probabilities, and there's always a chance of being wrong.
To mitigate this risk, we've marked an invalidation level around 42.69. If this level is breached, our analysis would be invalidated.
Projecting the target for Wave ((5)) using the 123.6% of Wave ((4)) measurement, we get a long-term target of around 146.56. This is a possible target, but please keep in mind that this is an educational study and not a trading tip or advice.
Before making any trading decisions, please conduct your own analysis or consult with a technical expert or financial consultant.
I am not Sebi registered analyst.
My studies are for educational purpose only.
Please Consult your financial advisor before trading or investing.
I am not responsible for any kinds of your profits and your losses.
Most investors treat trading as a hobby because they have a full-time job doing something else.
However, If you treat trading like a business, it will pay you like a business.
If you treat like a hobby, hobbies don't pay, they cost you...!
Hope this post is helpful to community
Thanks
RK💕
Disclaimer and Risk Warning.
The analysis and discussion provided on in.tradingview.com is intended for educational purposes only and should not be relied upon for trading decisions. RK_Chaarts is not an investment adviser and the information provided here should not be taken as professional investment advice. Before buying or selling any investments, securities, or precious metals, it is recommended that you conduct your own due diligence. RK_Chaarts does not share in your profits and will not take responsibility for any losses you may incur. So Please Consult your financial advisor before trading or investing.
Hasbro Buy setupHello,
Hasbro, Inc. is all about bringing joy to families and kids with a wide range of entertainment products? Their lineup includes beloved brands like Power Rangers, Magic: The Gathering, Monopoly, My Little Pony, Nerf, Play-Doh, and Transformers.
Their PEPPA PIG brand had a fantastic year, thanks to the success of Hasbro's own PEPPA PIG product line, which debuted in the latter part of 2021.
Recommendation: Hasbro is primed for growth. Consider buying now at $49.14 per share, with a target price of $103.97. The first target is set at $74.56.
Good luck!

Toy season incomingNASDAQ:HAS stock price has lost 40% in the past couple months. The strength of the bearish trend is strong in the short term . A strategic long position could be built to take advantage on a rebound in the next months. For the long term, a position could be opened in the incoming weeks to be exposed in the market.
Why Long?
Extended stock price from short-medium averages in a downtrend weekly chart.
Enough strength on negative momentum highs for the price to go find liquidity at the short period average.

HAS hitting long term demandHAS hit demand zone and bounced. 58.13, 61.78 and 66.97 are all good targets to be hit

HAS is in bottom zone HAS RSI MONTHLY Chart , everytimes RSI hit below 35.6 , it is the bottom zone .

Stocks pairs trading: HAS vs EAIn the gaming sector, Hasbro (HAS) and Electronic Arts (EA) provide intriguing comparative financials and growth trajectories. A strategic position of going long on HAS and short on EA could take advantage of their distinct market positions and financial metrics.
Why Buy HAS:
Valuation : HAS exhibits a P/E of 28.76, which compared to EA’s 35.73, suggests a more modest market expectation and a potential undervaluation.
Dividend Yield : HAS offers a dividend yield of 3.10%, which is substantially higher than EA’s 0.57%, indicating a better return on investment through dividends.
Diversification and Stability : HAS's broad product line, including toys and board games, may offer more stability against market downturns, especially in the volatile gaming sector.
Why Sell EA :
Forward P/E : EA’s forward P/E of 16.65, while lower than its current P/E, might not fully capture potential risks in the gaming industry, including stiff competition and hit-driven volatility.
Short Interest : EA has a short float of 1.23%, suggesting there is already some market skepticism about its current valuation which may support a short sell strategy.
Performance Metrics : Despite recent upticks in performance, EA's historical EPS growth rate over the past five years was -2.89%, potentially indicating an underlying weakness.
Decision:
BUY 3 HAS
SELL 1 EA

Long Picks 9/8These 4 are my top Long ideas for today into the future until the price stays above the Green TrapZone.
The picks are based on momentum, volume and price action.

HAS the return of the FURBy 2023They brining the furby back 2023. HAS will be a big boy stock could see some pretty good sales from this and have a good earnings assuming it’ll be a hit like it was in the 90s…
Chart looks solid. w pattern breakout and now a bull flag has been formed. Breakout and hold above 65.50 is an easy long targeting 75$.
Think I’ll be searching for a postion in this soon
I like the 65 breakout or one more pul back into the flag support lower price of 59.90 or so if we come back down to retest again.
Either way solid investment for this year and coming. should see a great reversal. Has already been doing so much more in it

Hasbro is Making Big Mistakes with its Cash CowFor anyone who doesnt know about magic the gathering, it is a collectable card game that accounts for a large portion of hasbros sales.
They have been on a downward spiral with poor decisions around the products they offer now and players are getting sick of it.
On the 30th year anniversary, hasbro, via wizards of the coast, released an exclusive high end product line, that in my opinion alienated the average mtg consumer.
The introduction of serialized cards has been very mixed in its reception. The overload of products has overwhelmed customers, and confused them.
Hasbro is basically squeezing liquidity out of wizards of the coast, at the expense of the game. This is very alarming to me as both a player and share holder.
I would be very careful trading hasbro. I think it is going to take a 4th quarter dive.


HAS - Ready-Aim-Fire / Slow Stochastic ShortPrevious heavy downtrend.
1-2-3 reversal trade in progress, but resistance at RAF extreme and Vscore = 1 (65.05).
Volume Profile resistance at 65.40.
Looking to Buy puts on a breakdown from the Minor High.
21APR23 62.50 Puts based on Open Interest and proximity to price.
Stop Loss is 25%.
First Profit @ 60.50.

$HAS: Guaranteed 90 : VERY BULLISH X 1000 TIMES AND MORE TICKER: $HAS
TIME FRAME: 1D
INVESTMENT STRATEGY: LONG
--------------BROKE THE FALLING WEDGE, AND RETESTED
--------------ABOVE 2OMA: BULL BULL BULL
TRENDSI TRADES GIVING BUY SIGNAL WITH GREEN DOT AND GREEN LINES IN 1D TIME FRAME. THANKS TO TRENDSI FOR GIVING ME CONFIRMATION.
I CAN SEE THIS GOING TO TEST 200MA (I.E. 90s)
Follow for daily stock, crypto and forex technical analysis.
⚠️ Trading is risky, and I understand nothing is guaranteed. Proper risk management should be in place at all times to minimize losses. Please consult a financial advisor before trading. All Inclusive Trading LLC is not a financial advisor and may not be held liable for any losses which may occur.

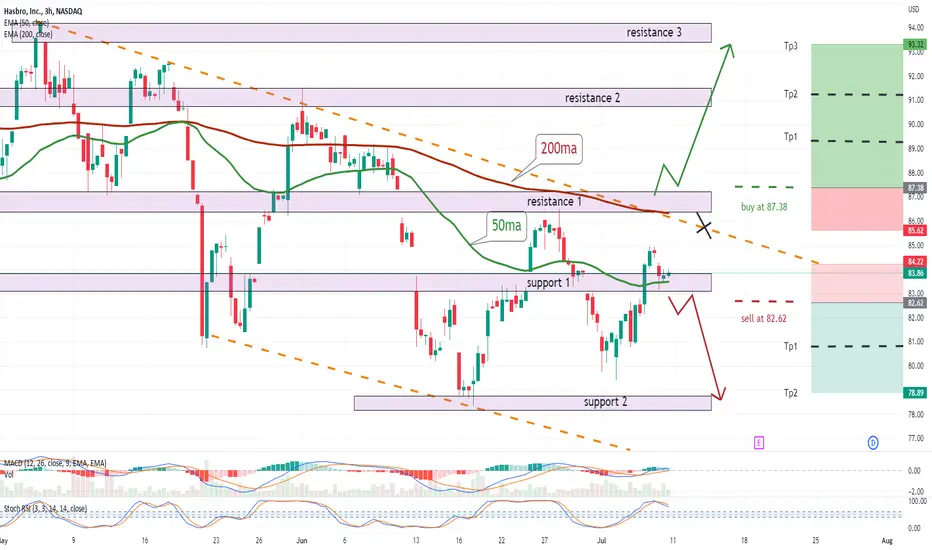
has 2 scenarioshasbro 2 scenarios .. 1] buy after the break above the resistance 1 and 200ma .. 2] sell under the support 1 and 50ma ...
Trading Idea - #HasbroMy short term trading idea for #Hasbro - Sell / Short.
Target: 88.00 USD (+2%)
Stop: 91.00 USD

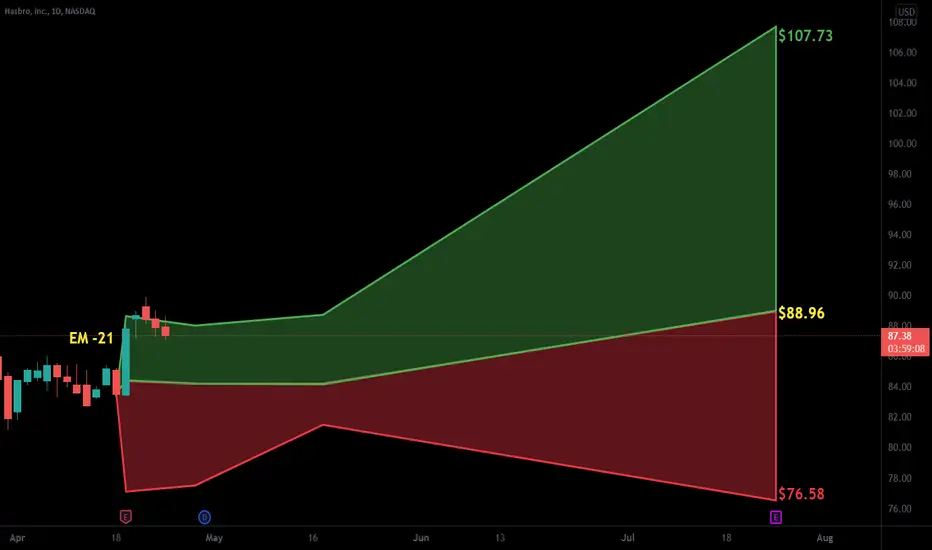
$HAS with a Bullish outlook following its earnings #Stocks The PEAD projected a Bullish outlook for $HAS after a Negative over reaction following its earnings release placing the stock in drift C with an expected accuracy of 100%.
Earnings watch 2/7 pre-marketEarnings watch 2/7 pre-market:
HAS
ON
TSN
CRNC
CRNT
CNA
ENR
ZBH
NSSC
AMG
Do your own due diligence, your risk is 100% your responsibility. This is for educational and entertainment purposes only. You win some or you learn some. Consider being charitable with some of your profit to help humankind. Good luck and happy trading friends...
*3x lucky 7s of trading*
7pt Trading compass:
Price action, entry/exit
Volume average/direction
Trend, patterns, momentum
Newsworthy current events
Revenue
Earnings
Balance sheet
7 Common mistakes:
+5% portfolio trades, capital risk management
Beware of analyst's motives
Emotions & Opinions
FOMO : bad timing, the market is ruthless, be shrewd
Lack of planning & discipline
Forgetting restraint
Obdurate repetitive errors, no adaptation
7 Important tools:
Trading View app!, Brokerage UI
Accurate indicators & settings
Wide screen monitor/s
Trading log (pencil & graph paper)
Big, organized desk
Reading books, playing chess
Sorted watch-list
Checkout my indicators:
Fibonacci VIP - volume
Fibonacci MA7 - price
pi RSI - trend momentum
TTC - trend channel
AlertiT - notification
tickerTracker - MFI Oscillator
www.tradingview.com

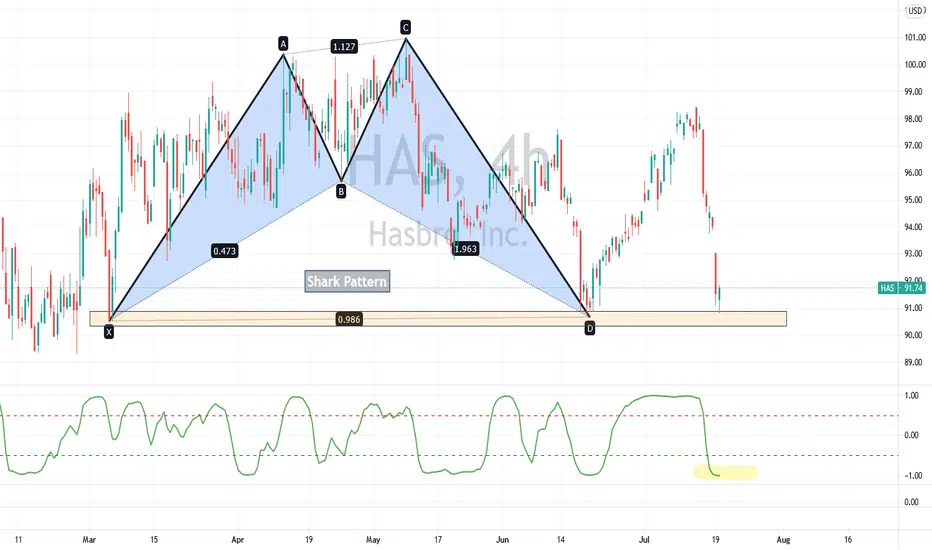
Hasbro (HAS)...Will the Shark Repeat ??From mid June Hasbro had a nice run of nearly 10% and right back again.
Will Santa strike again.
As usual do your own due diligence and respect market direction.
In this environment, that may be a challenge
Don't chase !
Consider a purchase closer to $90.
S.
Long on Hasbro with stoploss at 96 and take profit at 105The trend is bullish, resistance was already tested several times, price is consolidating. Earnings report might affect the price, therefore idea is valid till the report date.

$HAS is following the chart nicely$HAS books higher earnings in January, historically each year except for 1 in the past 5 years.
It had a golden cross forming so I got into commons on the dips.
I expect it to make some nice moves in January, where i plan to see the "top".
Golden cross is within the next few days.

$HAS - Target of $100.5 - $103.25Learning Elliot Wave Theory. Looks like a great setup within parameters and rules except that wave 3 is not as strong as traditional setup.

$HAS - golden cross$HAS golden cross coming soon. It is a pattern I enjoy playing. No chart pattern or chart indicator is a guarantee.
Golden crosses on the horizon (within 1-35 days)
AA - I want in, but afraid
BAC
BOX
CARS
DBX
GE - Im in
HAS - Im in
LYFT
MLHR
MMM - Im in
NTAP
NTR - Im in
URG
WB
NNDM - Im in
ADS
BA
C
CONN
COTY
CRON
CSCO
EBIX
GNUS
JWN
M
MIXT
MO
NCLH
PSEC
SPG
UAL
WTFC
SPYD
EEFT
FNB
BNS
Recently golden crossed and no where near entry or entry is still good to play the golden cross
OLN
RVLV
AXP
IMMR - Im in
DFS
EXPE
F - Im in
FBC
FCEL - Im in
IDEX
JPM
MET
MOS
STT - Im in
ULTA
WEX
Personal plays and cashed out today on golden cross:
IDEX +50%
MET +27%
ULTA +18%

