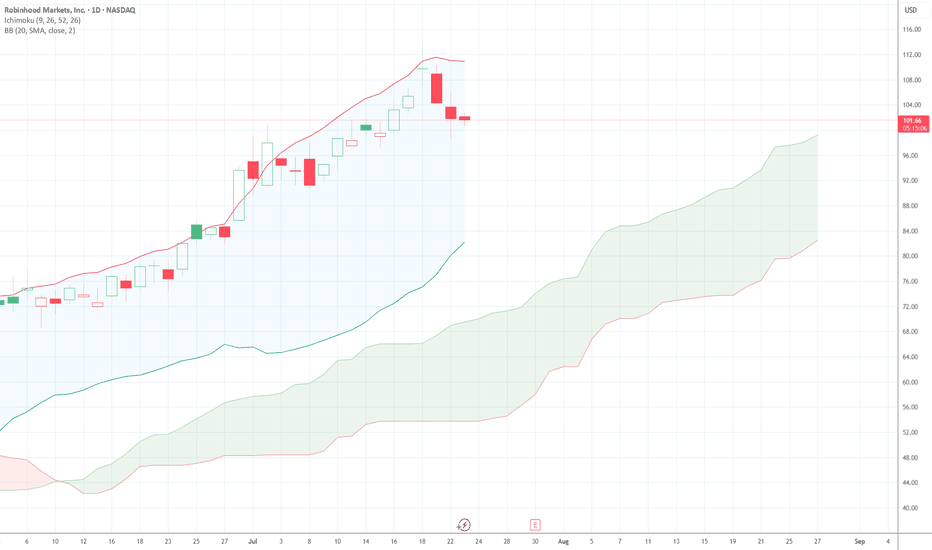
HOOD WEEKLY TRADE IDEA – JULY 21, 2025
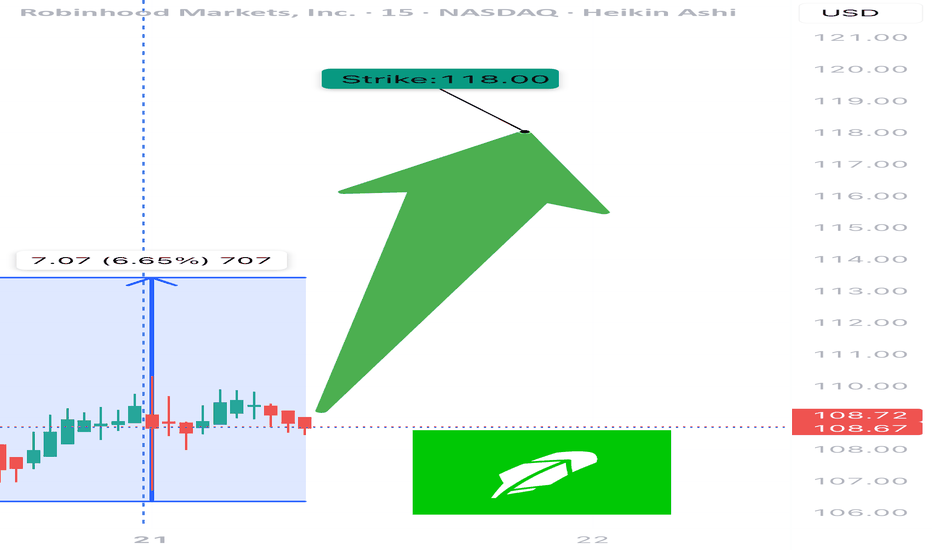
🪙 NASDAQ:HOOD WEEKLY TRADE IDEA – JULY 21, 2025 🪙
📈 Flow is bullish, RSI is aligned, and the options market is betting big on upside.
⸻
📊 Trade Setup
🔹 Type: Long Call Option
🎯 Strike: $118.00
📆 Expiry: July 25, 2025 (4DTE)
💰 Entry Price: $0.68
🎯 Profit Target: $1.36 (💯% Gain)
🛑 Stop Loss: $0.4
Key facts today
Robinhood Markets (HOOD) was excluded from the S&P 500 index, despite a larger market cap than recent additions like The Trade Desk and Block, with unclear decision-making.
Robinhood Markets saw a 1% decline in its stock price on Friday, coinciding with a broader downturn in crypto-related stocks.
Next report date
—
Report period
—
EPS estimate
—
Revenue estimate
—
1.80 USD
1.41 B USD
2.98 B USD
739.47 M
About Robinhood Markets, Inc.
Sector
Industry
CEO
Vladimir Tenev
Website
Headquarters
Menlo Park
Founded
2013
FIGI
BBG008NMBXN8
Robinhood Markets, Inc is a financial services platform, which engages in the provision of retail brokerage and offers trading in U.S. listed stocks and Exchange Traded Funds, related options, and cryptocurrency trading, as well as cash management, which includes debit cards services. The company was founded by Vladimir Tenev and Baiju Prafulkumar Bhatt in 2013 and is headquartered in Menlo Park, CA.
Related stocks
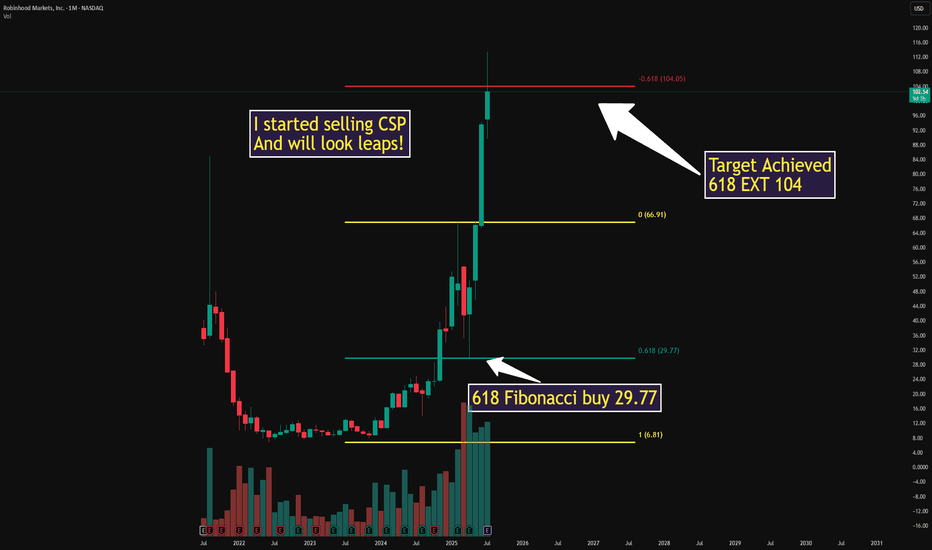
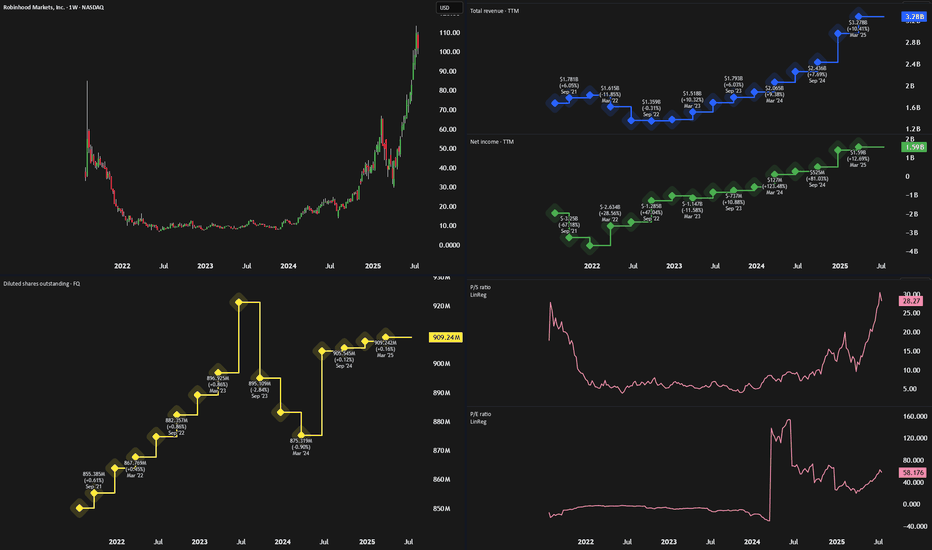
Everyone's Bullish On Robinhood - But Its Time To SellRobinhood NASDAQ:HOOD has seen an incredible rally over the past year, rising more than 500% since August 2023. Much of this surge has been driven by renewed crypto enthusiasm—sparked by Circle’s IPO—and Robinhood’s aggressive push into new products across fintech and crypto.
But despite strong
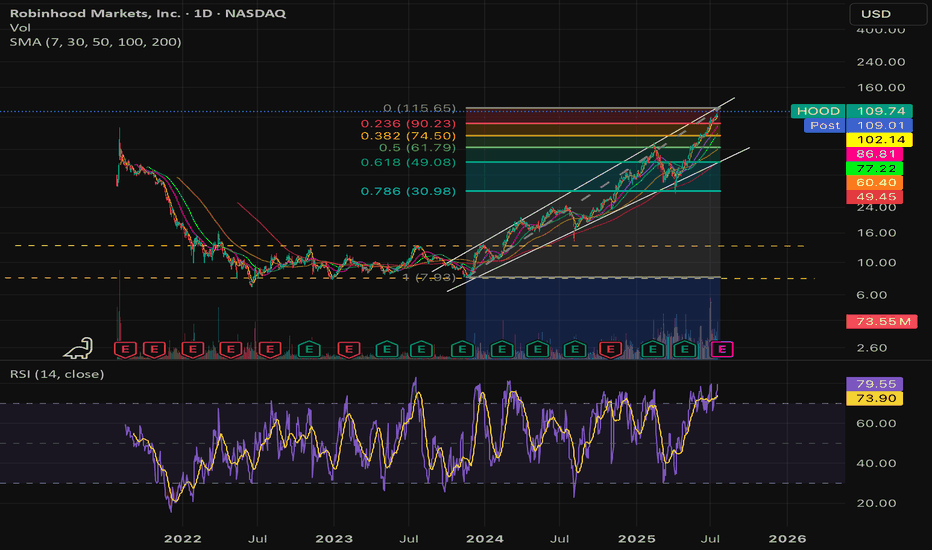
$HOOD Swing Trade – Riding the Rocket or Chasing the Wick?
🚀 NASDAQ:HOOD Swing Trade – Riding the Rocket or Chasing the Wick? 📈
📅 Posted: July 18, 2025
💡 Strong momentum, but no institutional push – is this the top or just getting started?
⸻
🧠 Multi-AI Model Summary
Model Consensus 🟢 Cautiously Bullish
RSI (Daily): 78.5 → 🚨 Overbought territory
5D/1
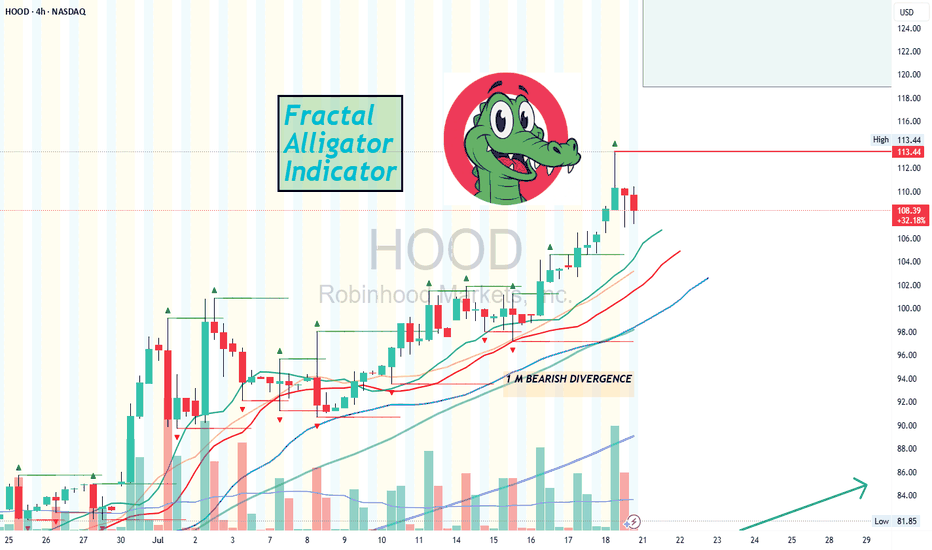
Using the Fractal Alligator IndicatorAccording to the Fractal Alligator in TradingView, we have come to a top/peak of HOOD stock price.
Using a 4 hour chart we can clearly see that green triangle, marking our top.
However when viewing the daily chart, there is no "top" green triangle.
This indicator is great, if you try it on diff
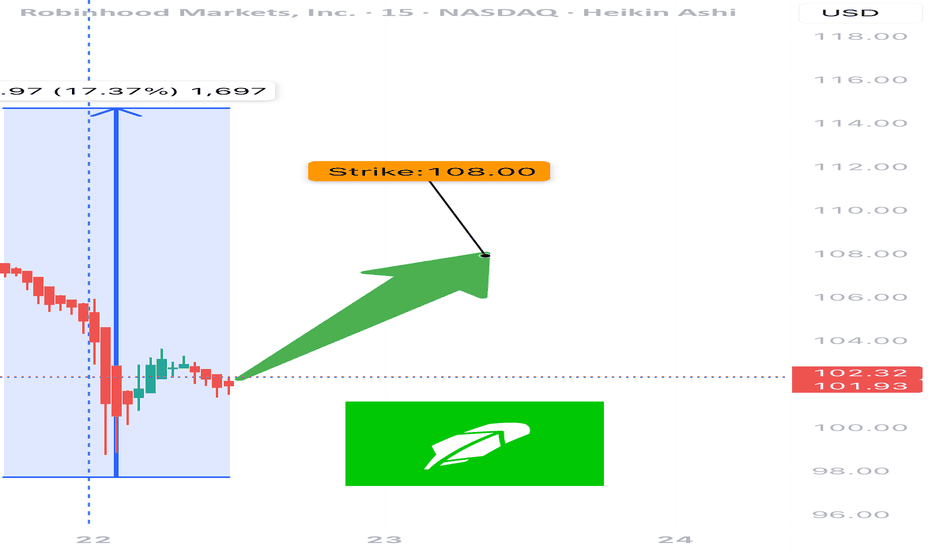
HOOD Weekly Options Setup – July 22, 2025
🔥 NASDAQ:HOOD Weekly Options Setup – July 22, 2025
Moderate Bullish Flow | RSI Divergence | 3DTE Tactical Setup
⸻
🧠 Summary Thesis:
While the call/put ratio (1.42) and favorable VIX (16.9) suggest bullish sentiment, fading RSI and neutral volume raise tactical caution. This setup is not for p
HOOD - Get Great PricingNASDAQ:HOOD and I have had a mixed relationship over the years. I have had my biggest win on the HOOD brokerage (5,000% options trade, $1200 into 60k) and at the same time I was present for the Derogatory removal of the GME button (of which I had sold before they took that button).
After many yea
HOOD Breakout Watch – Eyeing $103+
🧠 Chart Breakdown:
Setup: Price broke out of a large ascending triangle and is now forming a mini symmetrical triangle — a consolidation before a possible continuation.
Current Price: $99.94
Breakout Zone: Near $100, close to decision point.
📊 Key Levels:
Immediate Resistance:
$101.09 (yellow)
See all ideas
Summarizing what the indicators are suggesting.
Neutral
SellBuy
Strong sellStrong buy
Strong sellSellNeutralBuyStrong buy
Neutral
SellBuy
Strong sellStrong buy
Strong sellSellNeutralBuyStrong buy
Neutral
SellBuy
Strong sellStrong buy
Strong sellSellNeutralBuyStrong buy
An aggregate view of professional's ratings.
Neutral
SellBuy
Strong sellStrong buy
Strong sellSellNeutralBuyStrong buy
Neutral
SellBuy
Strong sellStrong buy
Strong sellSellNeutralBuyStrong buy
Neutral
SellBuy
Strong sellStrong buy
Strong sellSellNeutralBuyStrong buy
Displays a symbol's price movements over previous years to identify recurring trends.
Curated watchlists where HOOD is featured.
Frequently Asked Questions
The current price of HOOD is 104.85 USD — it has increased by 2.86% in the past 24 hours. Watch Robinhood Markets, Inc. stock price performance more closely on the chart.
Depending on the exchange, the stock ticker may vary. For instance, on NASDAQ exchange Robinhood Markets, Inc. stocks are traded under the ticker HOOD.
HOOD stock has fallen by −4.46% compared to the previous week, the month change is a 23.44% rise, over the last year Robinhood Markets, Inc. has showed a 395.51% increase.
We've gathered analysts' opinions on Robinhood Markets, Inc. future price: according to them, HOOD price has a max estimate of 125.00 USD and a min estimate of 47.00 USD. Watch HOOD chart and read a more detailed Robinhood Markets, Inc. stock forecast: see what analysts think of Robinhood Markets, Inc. and suggest that you do with its stocks.
HOOD reached its all-time high on Jul 18, 2025 with the price of 113.44 USD, and its all-time low was 6.81 USD and was reached on Jun 16, 2022. View more price dynamics on HOOD chart.
See other stocks reaching their highest and lowest prices.
See other stocks reaching their highest and lowest prices.
HOOD stock is 5.28% volatile and has beta coefficient of 3.21. Track Robinhood Markets, Inc. stock price on the chart and check out the list of the most volatile stocks — is Robinhood Markets, Inc. there?
Today Robinhood Markets, Inc. has the market capitalization of 92.53 B, it has increased by 4.61% over the last week.
Yes, you can track Robinhood Markets, Inc. financials in yearly and quarterly reports right on TradingView.
Robinhood Markets, Inc. is going to release the next earnings report on Jul 30, 2025. Keep track of upcoming events with our Earnings Calendar.
HOOD earnings for the last quarter are 0.37 USD per share, whereas the estimation was 0.33 USD resulting in a 13.74% surprise. The estimated earnings for the next quarter are 0.31 USD per share. See more details about Robinhood Markets, Inc. earnings.
Robinhood Markets, Inc. revenue for the last quarter amounts to 927.00 M USD, despite the estimated figure of 920.08 M USD. In the next quarter, revenue is expected to reach 912.09 M USD.
HOOD net income for the last quarter is 336.00 M USD, while the quarter before that showed 916.00 M USD of net income which accounts for −63.32% change. Track more Robinhood Markets, Inc. financial stats to get the full picture.
No, HOOD doesn't pay any dividends to its shareholders. But don't worry, we've prepared a list of high-dividend stocks for you.
As of Jul 26, 2025, the company has 2.3 K employees. See our rating of the largest employees — is Robinhood Markets, Inc. on this list?
EBITDA measures a company's operating performance, its growth signifies an improvement in the efficiency of a company. Robinhood Markets, Inc. EBITDA is 1.36 B USD, and current EBITDA margin is 38.82%. See more stats in Robinhood Markets, Inc. financial statements.
Like other stocks, HOOD shares are traded on stock exchanges, e.g. Nasdaq, Nyse, Euronext, and the easiest way to buy them is through an online stock broker. To do this, you need to open an account and follow a broker's procedures, then start trading. You can trade Robinhood Markets, Inc. stock right from TradingView charts — choose your broker and connect to your account.
Investing in stocks requires a comprehensive research: you should carefully study all the available data, e.g. company's financials, related news, and its technical analysis. So Robinhood Markets, Inc. technincal analysis shows the buy rating today, and its 1 week rating is buy. Since market conditions are prone to changes, it's worth looking a bit further into the future — according to the 1 month rating Robinhood Markets, Inc. stock shows the strong buy signal. See more of Robinhood Markets, Inc. technicals for a more comprehensive analysis.
If you're still not sure, try looking for inspiration in our curated watchlists.
If you're still not sure, try looking for inspiration in our curated watchlists.
