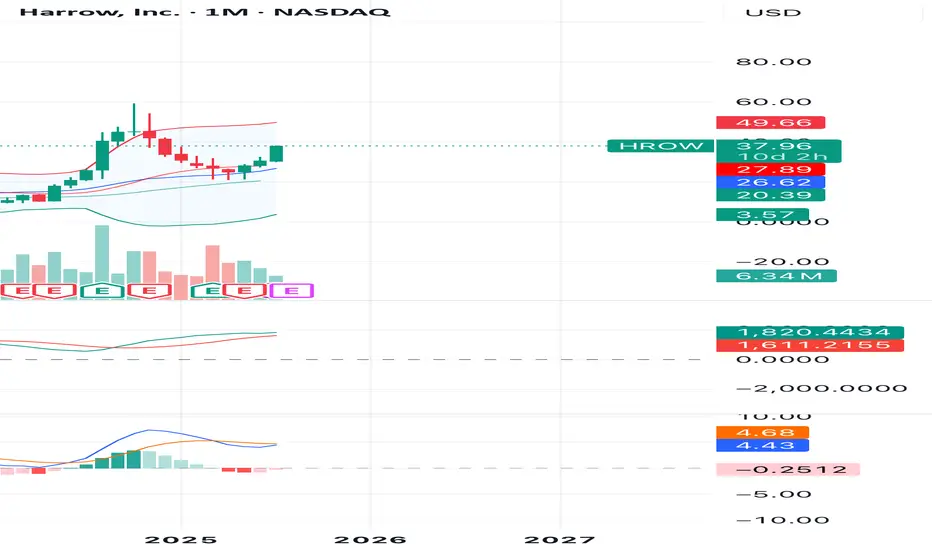
HROW heading to 49?HROW is trading around $37.8 and just broke a key resistance with solid volume.
Momentum looks good and price is holding above EMAs.
If this continues, I see it pushing toward $49 in the coming weeks.
Stop loss below $27.5
Worth keeping an eye on 👀🔥
Next report date
—
Report period
—
EPS estimate
—
Revenue estimate
—
−0.61 USD
−17.48 M USD
199.61 M USD
30.53 M
About Harrow, Inc.
Sector
Industry
CEO
Mark L. Baum
Website
Headquarters
Nashville
Founded
2006
FIGI
BBG000QXWY44
Harrow, Inc. engages in the development, production, and sale of innovative medications. It operates through the following segments: Pharmaceutical Compounding and Pharmaceutical Drug Development. The Pharmaceutical Compounding segment focuses on the operations of the ImprimisRx business. The company was founded by Mark L. Baum and Robert J. Kammer on January 11, 2006 and is headquartered in Nashville, TN.
Related stocks
HROW is breaking a resistance🧱 1. Pattern Identification: "Double or Triple Bottom"
🔍 At the bottom of the chart (March – May 2025), we can spot a double/triple bottom pattern.
This pattern forms when the price hits a low area multiple times without breaking lower. It suggests the price is struggling to fall further and mi

Harrow Inc. price action is bullishNASDAQ:HROW is coiling nicely and about to breakout, the stock will face the 200MA upon breakout which is expected to cause the stock to pullback. Anticipated price action and targets are shown on the chart, stop loss daily close below 29.5$
PS. My views only, not financial advice!

HARROW 16% INTRADAY DROP CAUGHT!Technical Analysis: HARROW (15-Minute Timeframe)
This chart demonstrates a highly profitable short trade executed with precision using the Risological Indicator. A stellar 16% profit was captured in this intraday trade, showcasing the power of momentum trading.
Trade Details
Stock: HARROW

HARROWCatch this wave 3. I think we are almost finished wave 2 wich is mostly the most extreme. So now i expect the wave 3 is going to start.

HROW: Can you guess what this pattern is called?See if you can guess it correctly. Earnings on 11/13

Eye Spy a MultibaggerI was hesitant to publish this chart because the extreme upside it shows will likely be viewed as unrealistic. However, HROW recently decisively broke above its 4-year trend channel as business developments have been quite positive lately - particularly with IHEEZO. This is a rare setup where the fu

HROW: Eye Spy A BottomHROW with a nice impulsive, 5-wave move off the low. HROW needs to hold the 0.618 retracement ($18.75) on this pull back, followed by a rally above the $19.95 local peak set today for further confirmation. Very bullish on the long-term prospects of this ticker.

HROW pull back - thoughts?Bounce off of 100 SMA, 2 long bullish candles with lots of volume, plus sound fundamentals. Any thoughts?

HROW - Long Setup Flag Setup with 2020 Insider Buying. Possible entry here or above 8.44., Stop signal 7.83, First target 9.23. 2nd Target Momentum.

See all ideas
Summarizing what the indicators are suggesting.
Neutral
SellBuy
Strong sellStrong buy
Strong sellSellNeutralBuyStrong buy
Neutral
SellBuy
Strong sellStrong buy
Strong sellSellNeutralBuyStrong buy
Neutral
SellBuy
Strong sellStrong buy
Strong sellSellNeutralBuyStrong buy
An aggregate view of professional's ratings.
Neutral
SellBuy
Strong sellStrong buy
Strong sellSellNeutralBuyStrong buy
Neutral
SellBuy
Strong sellStrong buy
Strong sellSellNeutralBuyStrong buy
Neutral
SellBuy
Strong sellStrong buy
Strong sellSellNeutralBuyStrong buy
Displays a symbol's price movements over previous years to identify recurring trends.
Frequently Asked Questions
The current price of HROW is 31.76 USD — it has decreased by −2.84% in the past 24 hours. Watch Harrow, Inc. stock price performance more closely on the chart.
Depending on the exchange, the stock ticker may vary. For instance, on NASDAQ exchange Harrow, Inc. stocks are traded under the ticker HROW.
HROW stock has fallen by −13.51% compared to the previous week, the month change is a 5.34% rise, over the last year Harrow, Inc. has showed a 30.32% increase.
We've gathered analysts' opinions on Harrow, Inc. future price: according to them, HROW price has a max estimate of 76.00 USD and a min estimate of 42.00 USD. Watch HROW chart and read a more detailed Harrow, Inc. stock forecast: see what analysts think of Harrow, Inc. and suggest that you do with its stocks.
HROW reached its all-time high on Oct 6, 2009 with the price of 160.00 USD, and its all-time low was 0.50 USD and was reached on Mar 16, 2012. View more price dynamics on HROW chart.
See other stocks reaching their highest and lowest prices.
See other stocks reaching their highest and lowest prices.
HROW stock is 6.26% volatile and has beta coefficient of 1.94. Track Harrow, Inc. stock price on the chart and check out the list of the most volatile stocks — is Harrow, Inc. there?
Today Harrow, Inc. has the market capitalization of 1.20 B, it has increased by 10.14% over the last week.
Yes, you can track Harrow, Inc. financials in yearly and quarterly reports right on TradingView.
Harrow, Inc. is going to release the next earnings report on Aug 11, 2025. Keep track of upcoming events with our Earnings Calendar.
HROW earnings for the last quarter are −0.50 USD per share, whereas the estimation was −0.05 USD resulting in a −986.96% surprise. The estimated earnings for the next quarter are 0.01 USD per share. See more details about Harrow, Inc. earnings.
Harrow, Inc. revenue for the last quarter amounts to 47.83 M USD, despite the estimated figure of 57.00 M USD. In the next quarter, revenue is expected to reach 66.00 M USD.
HROW net income for the last quarter is −17.78 M USD, while the quarter before that showed 6.78 M USD of net income which accounts for −362.36% change. Track more Harrow, Inc. financial stats to get the full picture.
No, HROW doesn't pay any dividends to its shareholders. But don't worry, we've prepared a list of high-dividend stocks for you.
As of Aug 1, 2025, the company has 382 employees. See our rating of the largest employees — is Harrow, Inc. on this list?
EBITDA measures a company's operating performance, its growth signifies an improvement in the efficiency of a company. Harrow, Inc. EBITDA is 21.04 M USD, and current EBITDA margin is 11.47%. See more stats in Harrow, Inc. financial statements.
Like other stocks, HROW shares are traded on stock exchanges, e.g. Nasdaq, Nyse, Euronext, and the easiest way to buy them is through an online stock broker. To do this, you need to open an account and follow a broker's procedures, then start trading. You can trade Harrow, Inc. stock right from TradingView charts — choose your broker and connect to your account.
Investing in stocks requires a comprehensive research: you should carefully study all the available data, e.g. company's financials, related news, and its technical analysis. So Harrow, Inc. technincal analysis shows the sell today, and its 1 week rating is buy. Since market conditions are prone to changes, it's worth looking a bit further into the future — according to the 1 month rating Harrow, Inc. stock shows the buy signal. See more of Harrow, Inc. technicals for a more comprehensive analysis.
If you're still not sure, try looking for inspiration in our curated watchlists.
If you're still not sure, try looking for inspiration in our curated watchlists.