HSIC - fall -47% to 70 cents per share on February 27The last earnings report on September 30 showed earnings per share of $1.32, meeting the estimate of $1.32. P/B Ratio (2.843) is normal, around the industry mean (13.831). P/E Ratio (23.627) is within average values for comparable stocks, (27.428). Projected Growth (PEG Ratio) (1.888) is also within normal values, averaging (4.510). HSIC has a moderately low Dividend Yield (0.000) as compared to the industry average of (0.030). P/S Ratio (0.837) is also within normal values, averaging (8.131). With 2.99M shares outstanding, the current market capitalization sits at 10.38B.
HSIC trade ideas

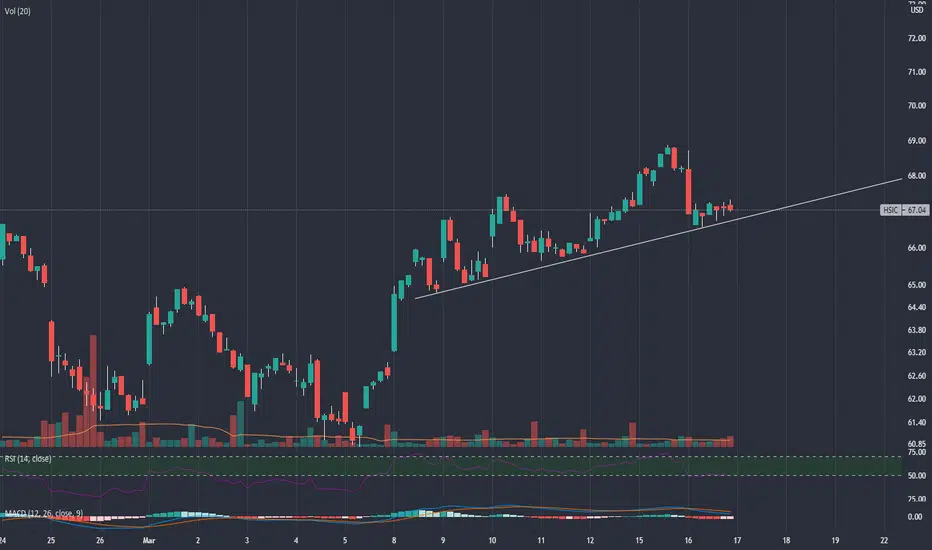
HSIC Bounces Resistance/SupportThis morning, the first trading day of 2023, I ran my S&P 500 spike scan like every morning. The spikes were skewed heavily to the bearish side with 99 Bearish Spikes and only 1 Bullish Spike. That spike was HSIC NASDAQ:HSIC . I like the context of this price action happening at the 50% Retracement of the bear move from the All Time High down to the October Low. Price recaptured and broke above the 78.72 Retracement Level and has now pulled back to test it as Support.
The 30m timeframe on Tradingview does not show the spike but the low of this morning's open was 78.70. This low can define the low risk for a 30 minute timeframe entry to play the broader move on the Daily timeframe to retest the ATH.

$HSIC with a Bullish outlook following its earnings #Stocks The PEAD projected a Bullish outlook for $HSIC after a Positive Under reaction following its earnings release placing the stock in drift A with an expected accuracy of 60%.

$HSIC looking to make the next leg higher!Notes:
* Solid earnings in the recent quarters
* Strong up trend in the long term
* Broke out of a base on base pattern
* Initially created a base of ~9 months, broke out and created a smaller base of ~4 week and is now breaking out again
* The ~9 month base was just above historical highs of $73.19 setting it as support
* Making new all-time-highs
* For the past 3 weeks it has been testing $87.55 as a new level of support with the volume drying up indicating that buyers and sellers are agreeing on this price
Technicals:
* Sector: Healthcare - Medical Distribution
* Relative Strength vs. Sector: 2.11
* Relative Strength vs. SP500: 5.05
* U/D Ratio: 1.79
* Base Depth: ~19.68%
* Distance from breakout buy point: 2.25%
* Volume 1.04% above its 15 day avg.
Trade Idea:
* You can look to enter now as the price is still pretty close to the broken level of $87.55
* Manage risk under $87.55
* If you're looking for a better entry you can look to buy around $88.72.

$HSIC could head higher if it breaks above $87.55.* Exceptional earnings
* Very strong up trend
* Sector: Healthcare - Medical Distribution
* Relative Strength vs. Sector: 8.68
* Relative Strength vs. SP500: 1.57
* U/D Ratio: 1.84
* Base Depth: 18.64%
* Volume 40.56% above its 15 day average.
* Recently retested highs from 2017 as support around $73.19 before pushing higher.
Trade Idea:
* Wait for a close above $87.55 as a confirmation that the price is ready to move higher.
* You can manage risk around $85.65

HSIC - Almost done consolidating for a run higherI believe HSIC is almost done consolidating. It's hard to tell on a weekly or daily chart , but I can see by Dec (but hopefully sooner) it should be ready for another move higher.
I will have to look at a possible way to play this Wednesday.

HSIC potential Bullish upside after earningsLong term uptrend is in tact.
Short term Price action is getting squeezed... break-out to upside very likely.
Seasonality for november performance for last 4yrs is 100% upside

Weekly Hidden Bullish Divergence Within Bull Flag on HSICI will be buying calls here and targeting the 1.618 retrace as a bullish target.

Long entry HSICPossible dip entry. Keeping low RR ratio because market been on uptrend for a long time. There will be some retracement soon.

HSIC Ichimoku PullbackToday's down move tested the middle of the consolidation following the pullback to the Daily Ichimoku cloud for NASDAQ:HSIC . This confirms a long trade to retest the major high.

$HSIC Breakout?After a period of consolidation $HSIC just had a breakout to new highs after an earnings surprise. This stock looks to be getting accumulated on every selloff. Could be a potential entry for a trend follower.

HENRY SCHEIN is to Buy Hey guys, HENRY SCHEIN is in a bullish movement on a strong trend support, the sellers were pushed back with force. HENRY SCHEIN climbs to the top of his stabilization zone, strong propability to breakout this zone to go directly to the top of the next one and seek the next higher point.
Please LIKE & FOLLOW, thank you!


HSIC, Henry Schein Inc. - On waiting for a breakoutNASDAQ:HSIC
We are still waiting for the Breakout on this double pattern in HSIC, head and shoulders of continuation and ascending triangle.
As always alerts will inform us to have the right timing by entering long in the market.
We are currently about four years into the development of this pattern, and a possible breakout could lead to start a new market rally on a historical company, which distributes fundamental healthcare material in the world, and which has suffered two difficult phases on the company value only during the general market downturn.
Stay Tuned!

HSIC, Henry Schein Inc. - Ready to BreakoutNASDAQ:HSIC
Analyze it as an Ascending Triangle or as a Head and Shoulders of Continuation...what we focus on is simply the level of resistance, in which either the price breaks or bounces, and depending on what happens we operate or wait.
At the end in this case if we define it as Ascending Triangle the reading of the pattern has highs of equal level and higher lows. If we define it Head and Shoulders of Continuation the Neckline is perfectly horizontal and the reversal has not happened and therefore the trend should continue.
How do we know that this operation works?
Simple. Backtesting analysis of the past.
What confirms the goodness of our operations over the years? The comparison of real results with those parameterized by the Backtesting.
Everything else is a matter of discipline.

HSIC Correction aheadLooks like a coorection is coming for HSIC (Henry Schein). It's a stock with a price footprint I like, so I will devote a small amount for some Long Puts (30-60 days long) and see what happens. Always a percentage of the position put aside for hedging. Good luck!

[HSIC] Phase 3 The price is higher than 30MM. Despite that, the price is going down. If the price breaks the resistance, buy.

Dow drops once again #45 (HSCI)This if it is a Double Top (M) of big proportions from a weekly view, look the magnitude of the bullish trend line
The Double Top (Confirmed)
The main Bull Trend line was broken in 2017-09-18 (Confirmed)
and some weeks after, the price did a bearish gap, visible from the weekly chart, that could not be filled, look (Red Circle)
Needless say,
Wait for a support breakout below 65.00 or anticipate a breakout
It's not my job to teach, I only mention it
Imagine that you are a Pro Trader and I'm telling you how to do your job
Bad news are good news for short sellers

Henry Schein wants to shine again!Henry Schein stock has become quite bearish after breaking a long 8 year trend support line in October 2016. The stock then tested this same trend line which became resistance and was rejected twice resulting in a 5-6 month sell off for ~30%. The mid Nov. 2017 low seems to be a long term floor for the stock and the price has had healthy gains since then. The MACD and RSI also support this. I am looking for the stock price to break the top of the flat top Kumo on the 4H chart which will be very bullish. If rejected, i'd expect the price to test the other end of the cloud in the short term.


HSIC - Trend Strategy TradeI have a signal in my trend based strategy for this stock to move to the upside also a strong support level. I will update this idea when something new comes up.
