IBBPotential Bat here. This has been, of course, a huge winner - I think it makes sense that Johnny Come Lately's would jump in here for another hurrah.
IBB trade ideas

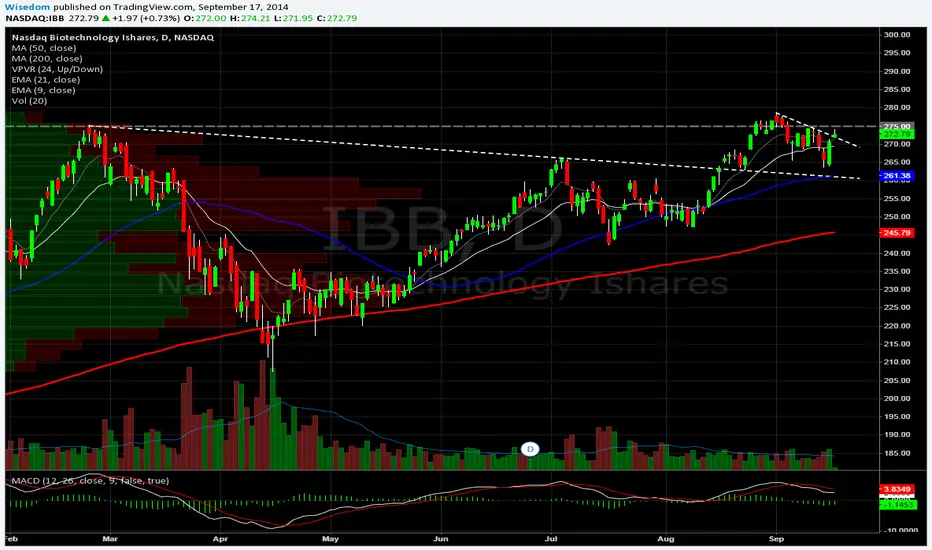
IBB- Speaking Of A Pullback To Multiple Supports?4-2 Speaking of a pullback to multiple supports?
As long as this issue stays above the blue
support lines all is well. This level also
happens to be near the 50 day SMA.
If you like these kind of chart set ups
don't forget to follow me here or on TWTR at
@AmazingPatterns
For educational and informational use only,
these are not recomendations , trade at
your own risk

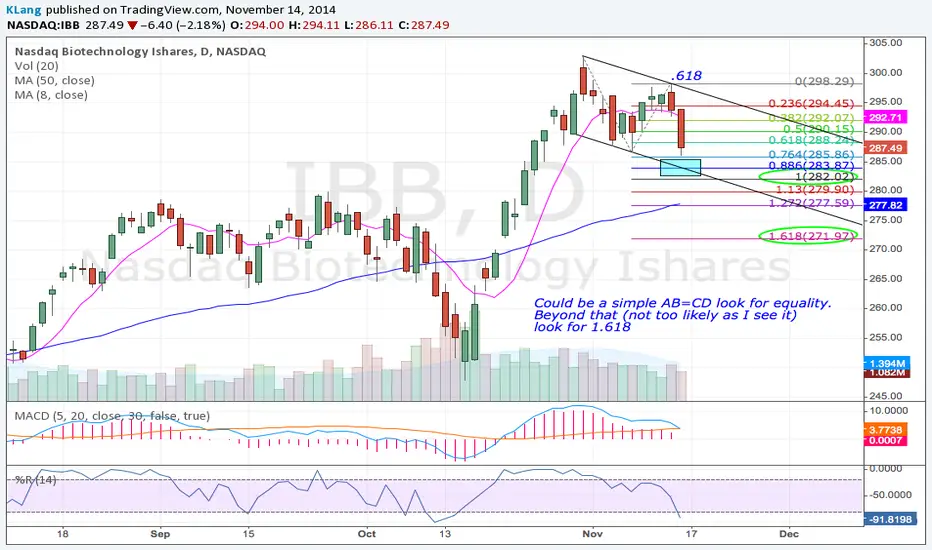
Did Friday marked the current top of BioTech?After breaking and violating my previous setup on $IBB, the selling action we've seen on expiration date could mean that options traders finally think $IBB has reached too far.
When this selling action comes with a daily bearish AB=CD pattern, it becomes interesting.
If indeed we will see a pullback, the first point of interest will be the meeting point with the broken trading channel shown in the chart. That will be the test point for the bulls - They can either confirm the breakout by buying at this level, or fail to hold against selling pressure and the breakout will turn into a false one, signaling the bears to keep on pounding a very overbought market.
I'm with the bearish AB=CD pattern, meaning - short.


Just a pullbackTake a look at the Volume Rate of Change and my notes. If it falls it is just a pullback.

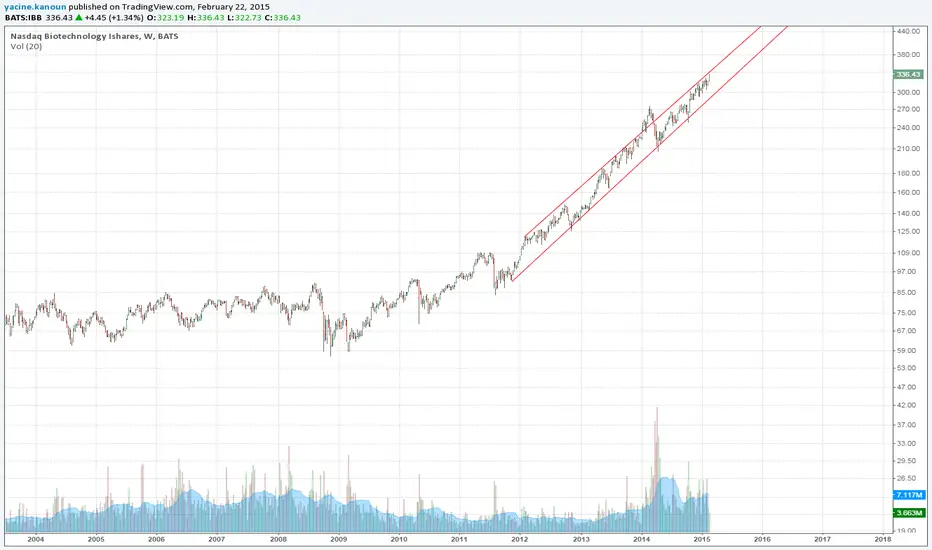
IBB from Monthly and WeeklyI traced IBB from the beginning of it upward sloping trend on a monthly chart.
Surely, if it continues to pullback, it will just fall to the purple trend line or the blue one. The blue one is right where there is horizontal support is.
On a logarithmic chart, the purple is 15 degrees in slope and the blue is 32 degrees in slope. So, IBB may go range until it go to these trend lines.

IBB - Biotech - Hot Burning Although there could be a correction in between, it may not be over.
The top could be at the end of the summer around 420.
That would complete a 640% rally since 2009. Remarkable.
The final stages of such rallies can be asymptotic and overshoot.. That could be in the next few month (Maybe after an intermediary correction).

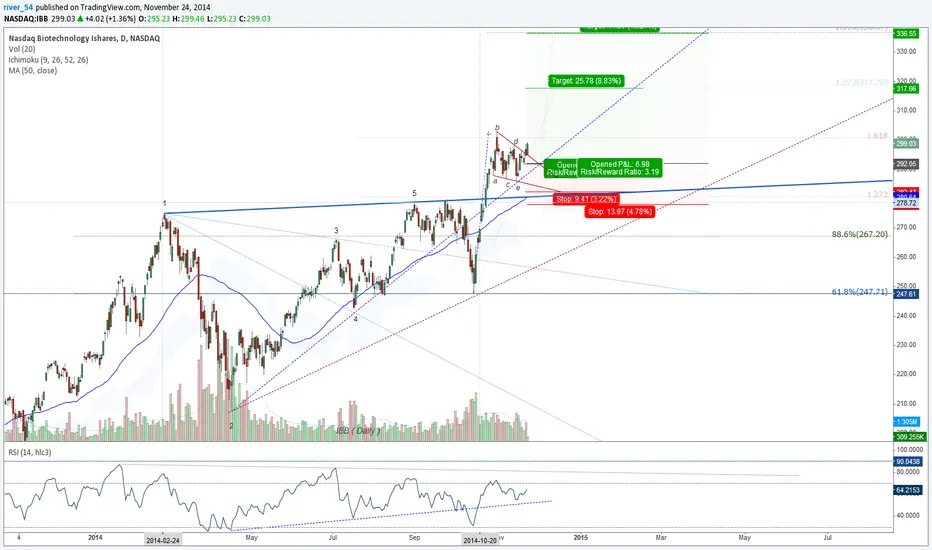
Perfect reversal from AB=CD pattern posted previouslyThe daily bearish setup posted here on TradingView, based on AB=CD pattern, is heading in the right direction after a perfect reversal at the PRZ.
First target - 300$

It is now or never for this AB=CD pattern$IBB at new ATH and inside the PRZ of this daily AB=CD harmonic pattern. 330$ should be the top of this spike high for this pattern to work

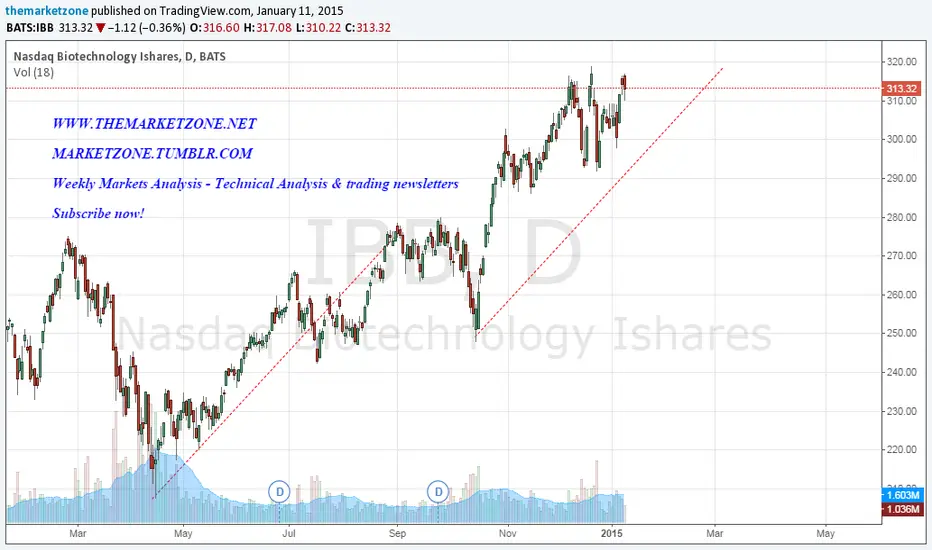
Biotechnology - Final Firework to 350?
That would be 10% up from here.
This index is constantly overbought for long while now.
You need to have a strong case to attempt shorts - 350 soon would be one of those.
if 350 before March - might be worth trying short.

Bearish AB=CD pattern in this week's newsletterRead the full analysis for $IBB in this week's Weekly Markets Analysis:
marketzone.tumblr.com
Bearish AB=CD pattern and some Fib extensions provide an interesting setup towards earnings season
IBBDouble Bottom - I've been told only rookies call this a double bottom because it's not at the bottom of a trend. Equal Bottom is said to be correct. But then I'd be accused of copying someone's work - so I'm stuck :)

IBB ( Daily )IBB ( Daily )
Potential Bull Flag brake_out. ( abcde waves )
Clearing 300 level, opens the door for further upside.
IBBSimilar look to ILMN. Wonder if we may see some rotation out of this leader from the correction into value like XLE

IBB, GILD and CELG - Is this where we see a bear channel build? As you can see this issue has broken its green uptrend to the downside. Now its all about whether or not this issue and those who look like it (CELG, GILD) build out bear channels (orange) and then break to the downside once they complete a bear channel. Later today I'll be posting more charts that look like these so stay tuned for more.
These are not recommendations. Strictly for informational purposes only. Do your own research.

Biotech sector-IBB, XBIBiotech sector has been on the boom since 2012, the uptrend seems continuing
Quarterly chart wise, it has shown some euphoric state.
We have a serious bearish RSI divergence shown, breaking of the uptrend line in RSI has serious
long-term consequence and detrimental to further uptrend.

Biotech sector - daily entryThis is my entry on the biotech sector. I believe this is a top. The moment this will go down, I will start adding to my short position.

Biotech Sector - Biotech sector is what you want to buy! Buy biotech! Everybody knows that right? Who doesn't know that you have to buy biotech stocks should not be trading stocks at all right? This sector is going down!
The patterns are explained on the chart. Check out the daily chart with my entry that is coming in a few minutes.