IBB trade ideas


Biotech ETF Tests the 50-day SMABiotechnology has been one of the stronger sectors this year. It’s benefited from the combination of Covid treatment hopes (vaccines + therapeutics), and the macro backdrop (low rates/negative GDP).
As we highlighted earlier in the month, the iShares Nasdaq Biotechnology Index ETF broke out to new highs in late June and has been holding its ground above those peaks. Today it chopped back down to test $135, which has emerged as support since our last post. (That $135 line is also near intraday peaks a few times in May.)
The other big line is the 50-day simple moving average (SMA). IBB recently bounced there, and now prices are revisiting it.
This idea isn’t super fancy, but these are classic patterns in a sector that could make sense fundamentally. Biotechs are a long-term secular growth story. Long-term trend followers may like the risk/reward near the confluence of these flat lines and the 50day SMA.

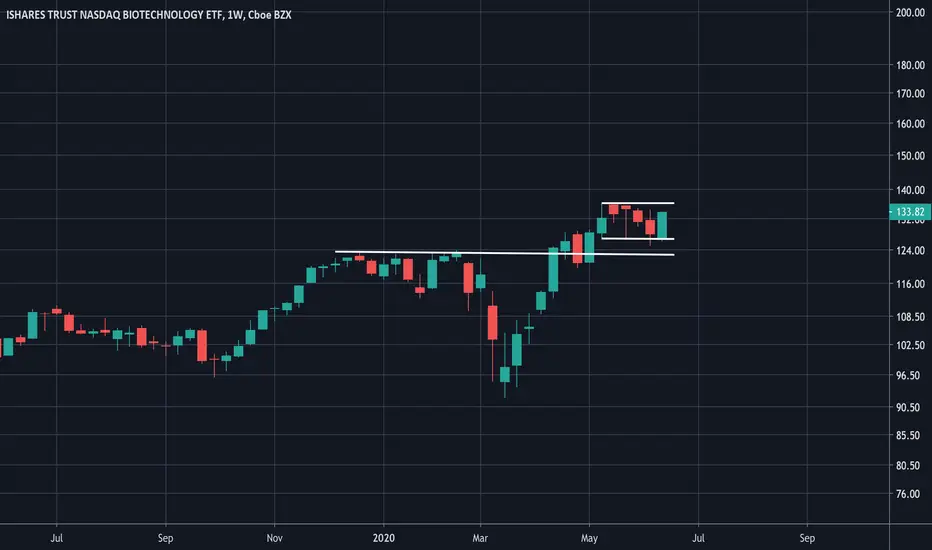
IBB What happens here is very important!The IBB is retesting a previous long term breakout level! What happens here is very important. If it holds, then that's bullish. If it breaks back below, then that would be a bearish development.

IBBMonthly candle coming back inside previous months range. One to keep on the radar for next week for a PUT protection play.


Biotechnology Stocks Have Broken OutEveryone’s attention is focused on today’s strong jobs report, but an under-the-radar sector is breaking out: biotechnology.
The iShares Nasdaq Biotechnology Index ETF hit new 52-week highs before the rest of the Nasdaq. And it wasn’t just any old breakout. It was the first move above $130 since mid-2015: a historic push to important long-term levels.
IBB did something similar in early 2012, closing above its previous high from 2001. It then proceeded to run more than 300 percent before halting.
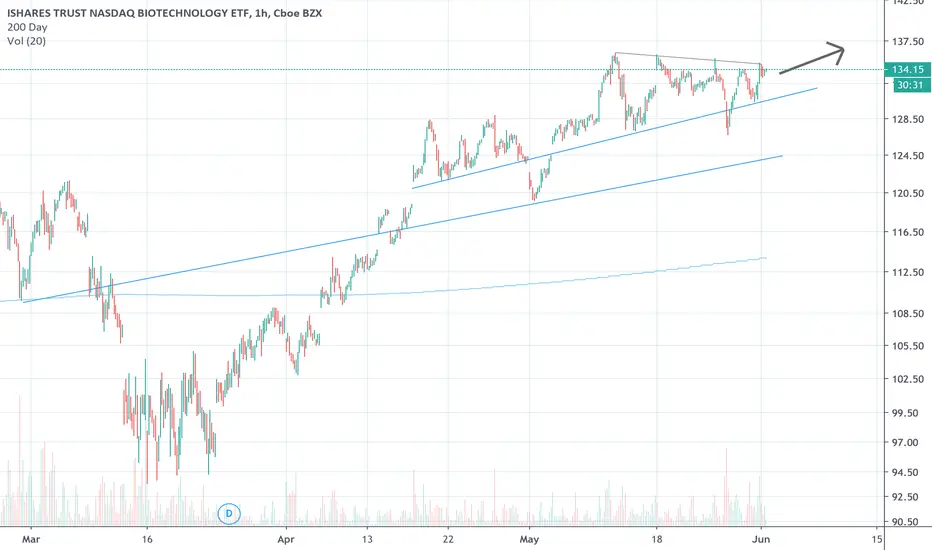
The daily chart has provided some confirmation of the uptrend continuing. After making a new 52-week high in April, it briefly tested below and snapped right back. Then in mid-June when the market had a brief crash, buyers defended IBB’s 50-day simple moving average (SMA).
And now in the last two weeks, IBB has broken above and held $133.60, the previous all-time high from five years ago. Has old resistance become new support?
Finally, it’s important to consider the macro backdrop: healthcare was already in a secular growth phase because of innovation and ageing populations. The prospect of coronavirus treatments is another positive. Then add a weak economic environment and low interest rates by the Federal Reserve. All of those conditions are supportive for a non-cyclical sector like biotechnology.

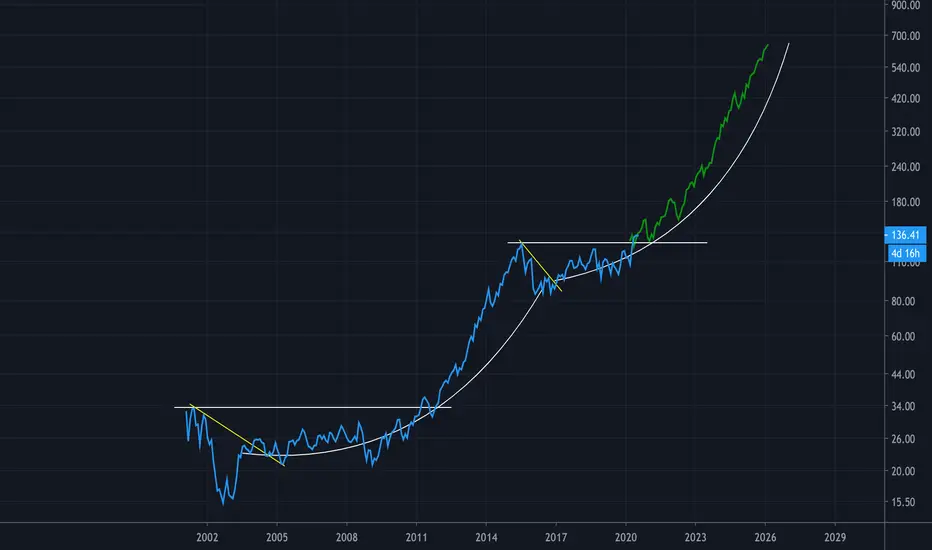
Long Biotech for Multi-Year CycleIBB looks to have a just broken out of a 5 year basing pattern. The longer the base, the higher in space. I'm going long 3-5 year hold with sell target of >$400.

$IBB at channel resistance with negative divergenceLook for further weakness and pullback following rejection at the channel with negative RSI divergence

IBBSystem T Performances: Annual Compound Profit 40%, Win Rate 55%, Risk/Reward Ratio 1:2, 20 Years of Backtesting Data, Over 100 Markets.
* Click Like and Follow to Support My Work!
---
Hi Traders,
I'd like to introduce the System T, a computerized trading system that analyzed and backtested the 20 years history data of over 100 markets.
This post is my sharing of how I think about systematic trading and the signals generated by the System T.
(This is my opinion only, NOT the financial advice.)
The System T is a comprehensive system which contains many components such as buy & sell signal generator, win & loss statistics, risk control & portfolio management to make sure trading is successful in the long run.
Basically, for the system to open a trade and manage risk, it only needs a buy signal & a stop-loss signal clearly on the chart.
Once the system finds a good trend, it will ride it as long as possible. The stop-loss will be adjusted accordingly to the new price movement.
(*) Remember to follow this trade idea and follow my profile to get updates about the stop-loss adjustment and sell signal based on the latest price and market conditions daily.
System T performances above will give you an idea of how it performs in the last 20 years.
Notice that this result was achieved only if I strictly followed the rule: "Only and Always Buy & Sell based on the System Signals".
Don't sell when there is no sell signal as we all want to follow the good trends til the end like everything in life does. \(^-^)/
Also, my system is extremely diversified through over 100 markets so that it only risks less than -1% of the total capital per trade.
Thank you and good luck!
---
DISCLAIMER:
I am NOT a financial advisor, and nothing I say is meant to be a recommendation to buy or sell any financial instrument.
My views are general in nature and I am not giving financial advice. You should not take my opinion as financial advice. This is my opinion only.
Do your own due diligence, and take 100% responsibility for your financial decisions.
Trading and investing are risky! Don't invest money you can't afford to lose, because many traders and investors lose money. There are no guarantees or certainties in trading.
- Content is for education purposes only, not investment advice.
- Trading involves a high degree of risk.
- We’re not investment or trading advisers.
- Nothing we say is a recommendation to buy or sell anything.
- There are no guarantees or certainties in trading.
- Many traders lose money. Don’t trade with money you can’t afford to lose.

$IBB Looking Near Term Over-extended$IBB Looking Near Term Over-extended
Long term rising wedge has formed. If broken, we could see $124.00 in medium term.
Note: Not investment advice.

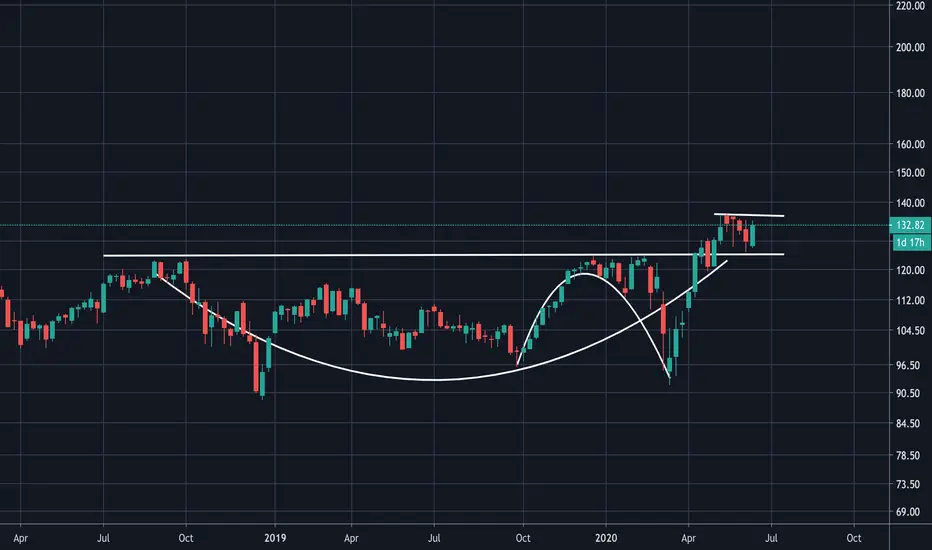

Big Biotechs Ascending TriangleIBB is forming an ascending triangle, which is a continuation pattern after the breakout.
Important to note the 20sma, which has been very supportive in the trend. The is also some support we can see many candlesticks with bottom wicks, meaning the shorts were met with buyers very quickly.

Biotech continues to grind higherLord knows many of the companies in this ETF are probably shite but $IBB continues to show strength. For now - long biotech !
Biotech is where the cool kids are doing!What I see...
+ Prices pulled back from $136 to find support from the rising 10ma
+ Friday's bar painted a bullish engulf-like body within a NR7 on very low volume! This is like a spring that is compressed and getting ready to bounce!
+ RSI is at 61 and has just turned upward
+ MACD is flat in the bullish zone
- MACD is technically below signal line
- $136 is first resistance
What I setup...
+ Long entry above Friday's high
- Stop under last week's low
+ Target at 1.618Fib
:: Duration - weeks!
** Comments and Likes are appreciated; New Subscribers are stronger than biotech! **

IBB is at all time highs and goes much higherOn a long term basis Biotech is finally coming into a new bullish phase. IBB is above 133 and is going much higher.

$IBB #IMFTchart Bullish wedge formingBullish wedge forming. After yesterdays huge Biotech moves, I would expect to see a continued downtrend until end of wedge.

IBB - reached forecasted target and should correctIBB reached the target we forecasted on May 6 and at this stage it should have completed primary wave 5. It should now start a correction that can take it to new lows. The alternative scenario would be that we would see a minor correction to around 115 before trend to new highs. However, in both cases prices should follow the path to at least arounf the most probable target of 115. If prices crosses up 136 this analysis should be reviewed. FOLLOW SKYLINEPRO TO GET UPDATES.

IBB - Biotech ETF could offer good potentialIBB seems to have starting minor wave 5 up that could lead its price to the most probable target of 134.00. This sector should be be one of the good options to be in during the current market scenario. If prices crosses down 199.70, this analysis should be reviewed. FOLLOW SKYLINEPRO TO GET UPDATES.

