IBB Strong BuyMay be the lowest you'll see biotech
Current pressures on the sector will blow by
PT 1: $400
PT 2: $500
IBB trade ideas


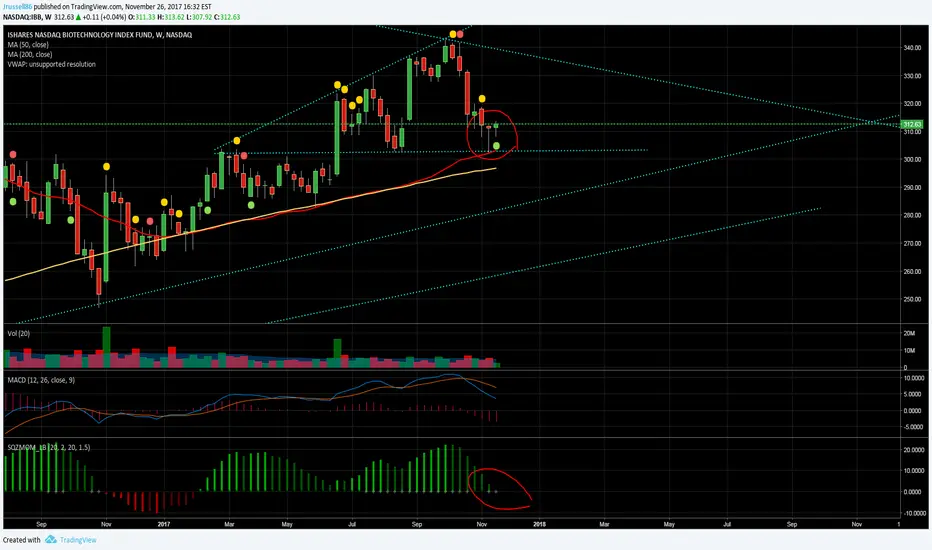
IBB broadening right-angle formationHammer candlestick on weekly, momentum going negative, might see retrace to 108 above support, but then should recover on good rally to continue pattern.
homework : Symmetrical triangle ETF IBBThe pattern contains at least two lower highs and two higher lows. When these points are connected, the lines converge as they are extended and the symmetrical triangle takes shape. The future direction of the breakout can only be determined after the break has occurred. Even though a continuation pattern is supposed to breakout in the direction of the long-term trend, this is not always the case.


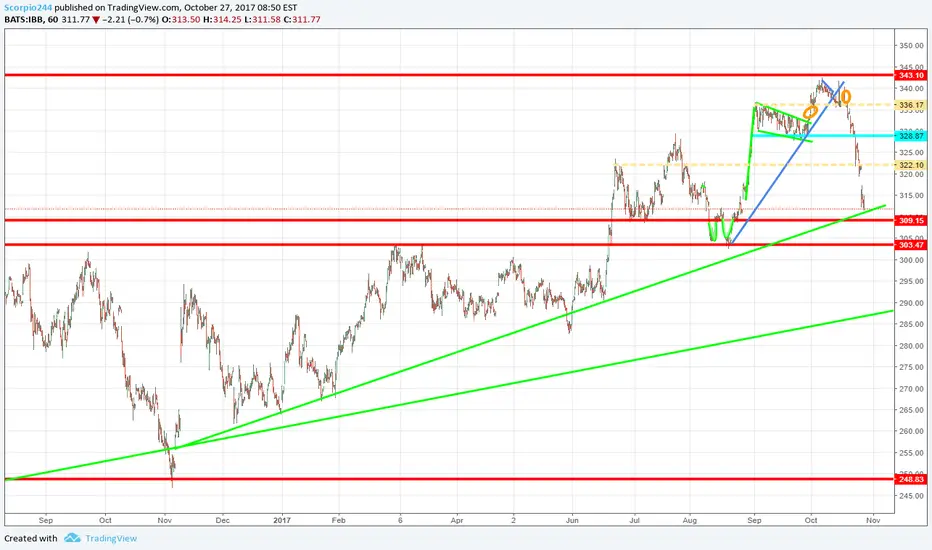
Example of a Rising Wedge on IBBIBB formed a rising wedge. Both lines are uptrend. The angle of ascent is steeper on the support line. The pattern form highs higher than previous and each low is successively higher as well. After a few attempts, the prices finally break through support.
To confirm the breakout, the price should close below the support line, if so, make a short. The profit target is the distance away as the back of the triangle.


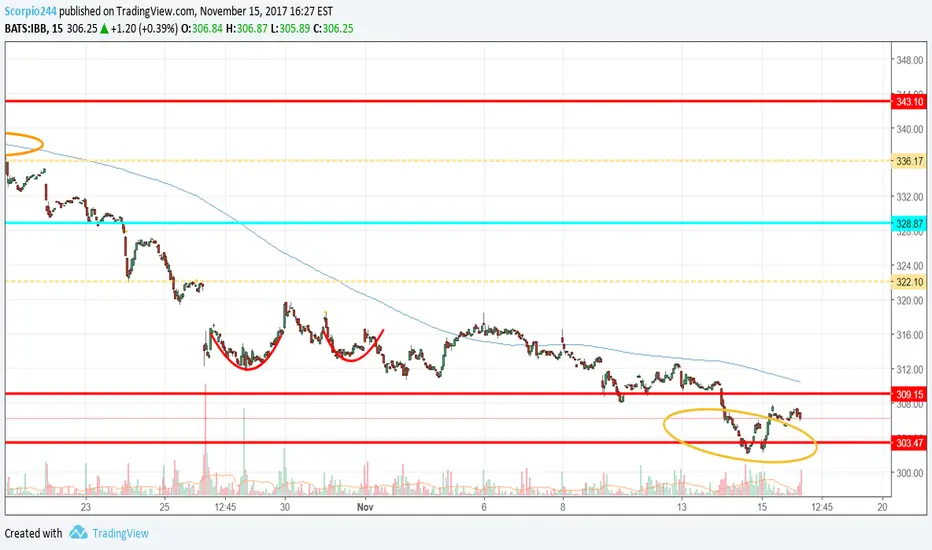
homework: ishares NASDAQ biotechnology ETF falling wegde The Falling Wedge is a bullish pattern that begins wide at the top and contracts as prices move lower. This price action forms a cone that slopes down as the reaction highs and reaction lows converge.


HOMEWORK: SYMMETRICAL TRIANGLE IBBSymmetrical triangle is a chart pattern , the price moves between two converging lines. The bottom trend line slopes up and the top one, slopes down. The volume usually trend downward.


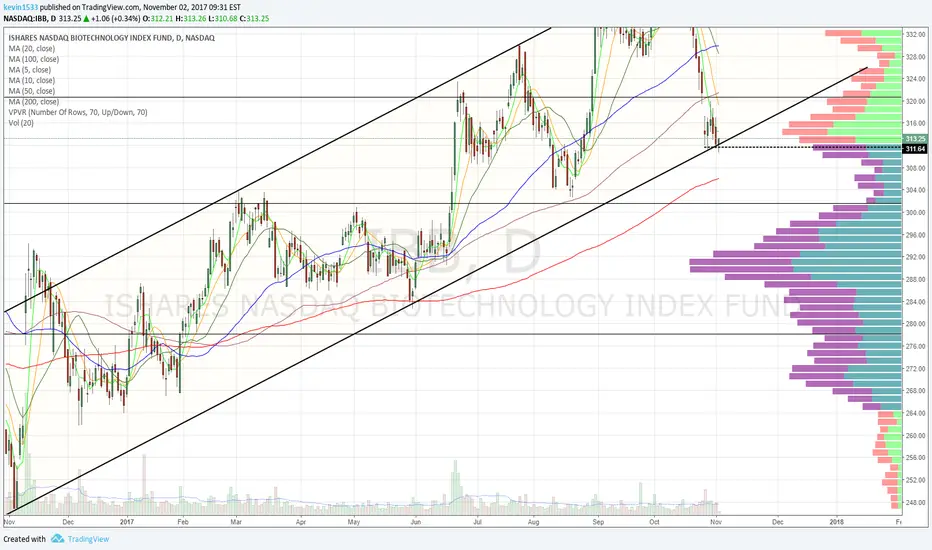
IBB longAn uptrend channel has formed since biotech broke out from the ascending triangle, using the same lower trendline as the triangle.
Today, IBB is rallying off of oversold RSI, as well as lower trendline. In the past, such oversold RSI has lead to decent rallies.
Bought LABU (a 3x etf) here. Stop below today's low.