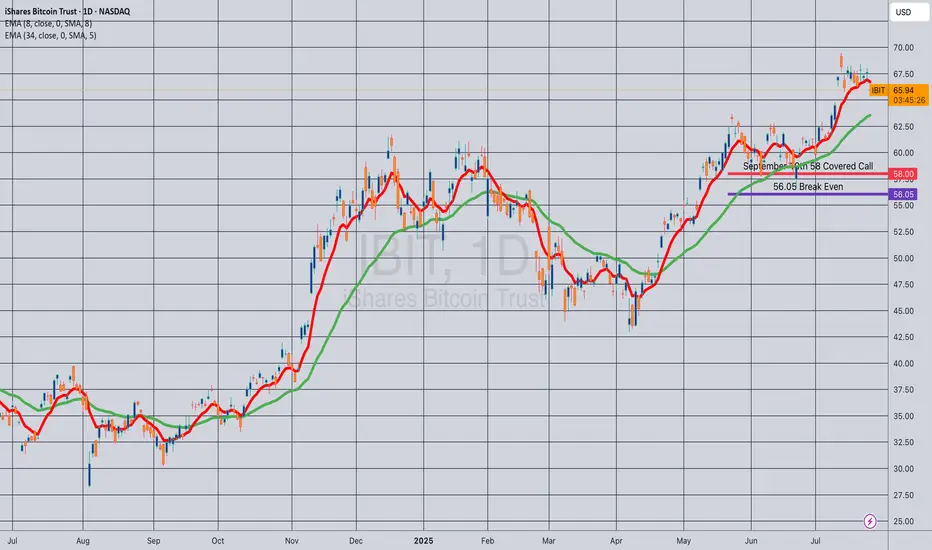
Opening (IRA): IBIT Sept 19th 58 Covered Call... for a 56.05 debit.
Comments: Selling the -75 delta call against shares to emulate the delta metrics of a +25 delta short put to take advantage of higher IV on the call side and the built-in defense of the short call.
Metrics:
Buying Power Effect/Break Even: 56.05
Max Profit: 1.95
ROC at Max: 3.48%
50% Max: .98
ROC at 50% Max: 1.74%
Will generally look to take profit at 50% max, add at intervals assuming I can get in at break evens better than what I have on.
IBIT trade ideas
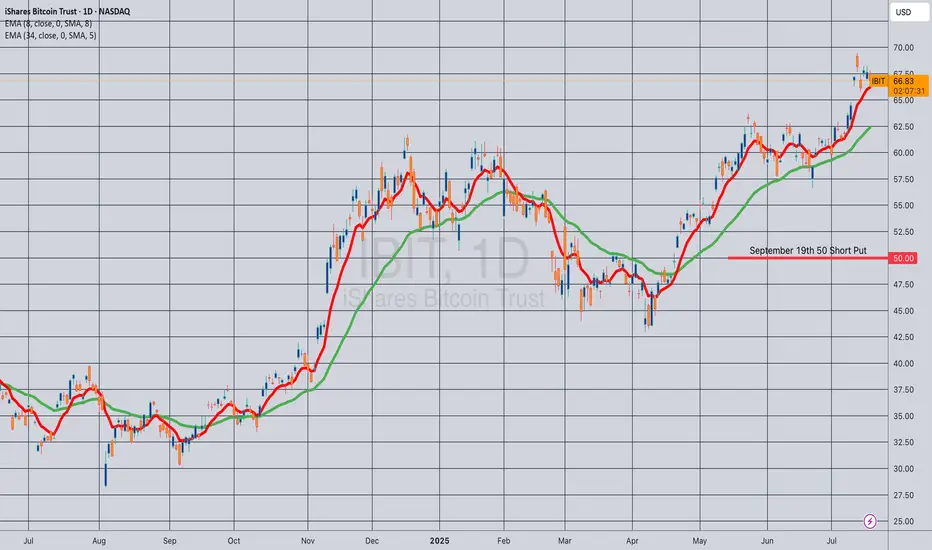
Opening (IRA): IBIT September 19th 50 Short Put... for a .52 credit.
Comments: Laddering out/adding at strikes better than what I currently have on, targeting the strike paying around 1% of the strike price in credit.
Will generally look to roll up at 50% max at > 45 DTE (Days 'Til Expiration).
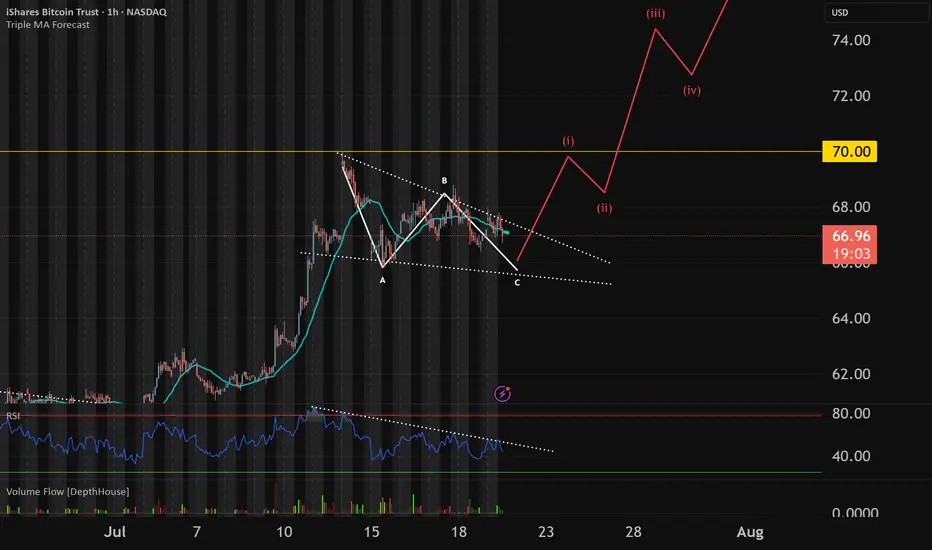
IBIT finishing C wave before next leg upIBIT is following an ABC correction after creating a new ATH. Crypto market has been hitting ATH in market value and ETH/alts have been expanding upwards as BTC has stalled which shows a rotation from large caps to rest of the market. This indicates a bull market cycle and we will be looking for a Euphoric BTC new ATH before a top is made. This is a dip to buy and will load up some more IBIT options on red days this week
Opening (IRA): IBIT July 25th 48 Short Put... for a .48 credit.
Comments: The highest 30-day IV on my ETF board (aside from USO and UNG). Laddering out, targeting the strike paying around 1% of the strike price in credit.

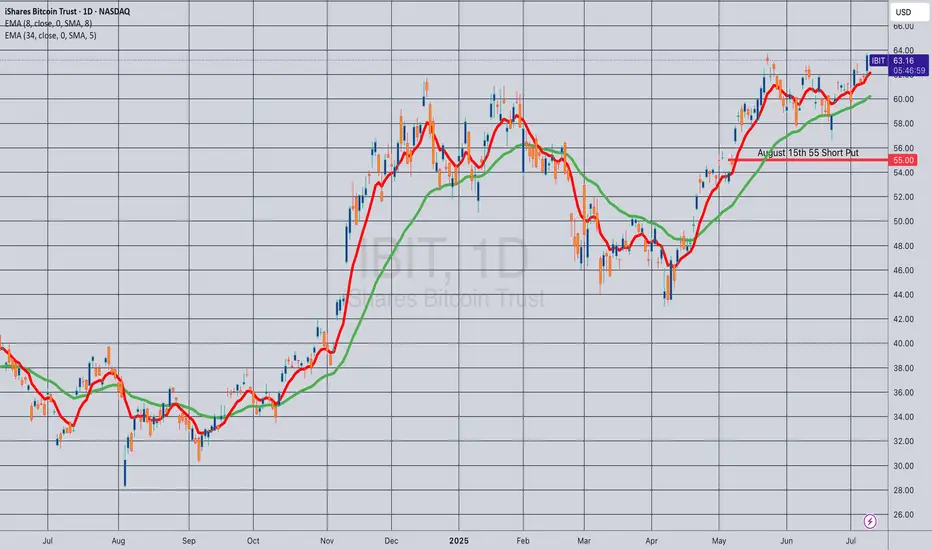
Opening (IRA): IBIT August 15th 55 Short Put... for a .62 credit.
Comments: One of the higher IV ETF's on my board. Targeting the strike paying around 1% of the strike price in credit.
Opening (IRA): IBIT July 18th 51 Short Put... for a .59 credit.
Comments: One of the higher IV ETF's on my board at the moment. A starter position, targeting the strike paying around 1% of the strike price in credit.
Will look to ladder out at intervals ... .

$IBIT a BITCOIN ETF Is Breaking Out of a Flat BaseNASDAQ:IBIT I have been looking at this for quite awhile now. I drew in an “area” of resistance, and it has hit that twice in the last few days. I bought a position on Jul 3rd and was stopped out. It just broke again so I have opened yet another position and will use a stop on a close below the 21 EMA (blue).
If you like this idea, please make it your own and trade it only using your own trading plan. Remember, it is YOUR money at risk.
IBIT - Trying to Confirm Upside BreakIf you are wanting BTC to breakout this is a very important chart. There is a chance IBIT is frontrunning the BTC breakout.
For the past 45 days IBIT has been forming some sort of parallel channel breakout with the top trendline being our orange trendline. We have had many touchpoints of resistance on this trendline (red arrows). Recently price broke out to the upside and re tested our orange trendline as new support (green arrow). This is a really good early signal of continuation to our 1.618 extension level. In addition to the trendline retest we have also seen the ltf 0.618 Fibonacci level holding as support.
However BTC is the main factor of if this will be a successful breakout or not. Right now BTC is still struggling with our red trendline of resistance. If BTC fails and starts to fade then IBIT will fall to and this will become a failed breakout. Will update this post when more confirmations develop.

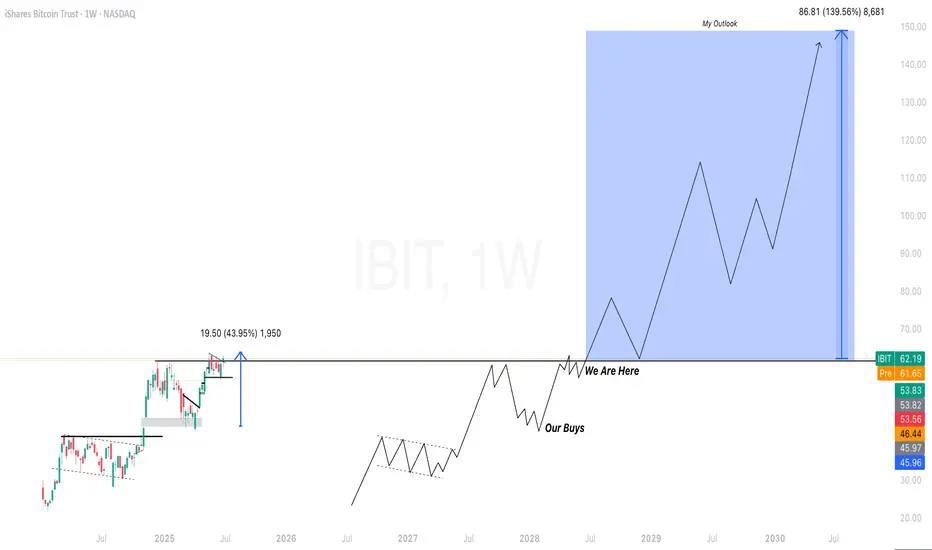
$IBIT Long Term Outlook BTC has tons of room for upside and I see the same for IBIT in the next 5 years 📈. Incredibly high conviction!
BTC - Channel is Broken, Now What?
The most bullish scenario right now is that the price stays in the upper part of the channel, tests the top of the channel and continues to rise.
If this breakout in BTC remains a manipulation, the price may also make the same manipulation downwards. When the price breaks through, my first thought is that it may find support at the midpoint of the channel, but this is a low probability. The higher probability is that it will make the same manipulation downwards and then re-enter the channel.

$IBIT: ETF can turn bullish in the weekly this week......if all goes well, and the daily trend works nicely (maybe hitting target #2 this week if news favor us in the coming days and gap fading a$$holes don't kill the trend if we get a 4th of July gap up), Bitcoin will start to trend up strongly.
The monthly timeframe is already bullish as of June's close on the 30th, so odds are good.
Are you positioned? Leave me comments below, what are you holding?
Trading perps or only spot? Using defi or merely hodling at CEX or cold storage?
Best of luck!
Cheers,
Ivan Labrie.

IBIT: End of June/Beginning of July Weekly idea for IBIT.
BTC and this market as a whole is an interesting character.
The indicies and many other things, such as BTC, AMD etc. are all throwing top signals, specifically mean reverting signals (when using Pairs / Cointegration and Time series).
They have been for the last 1.5 weeks.
These signals have yet to be invalidated, they are only invalidated once they stop signaling or flip to bullish. So we are lingering on a potential for a larger pullback from where we are, and that extends to indicies such as NDX, SPX and BTC itself.
That said, its a bit trickier when we push into extreme greed where the market currently rests.
For IBIT and BTC, the outlook is on the bearish side; however, with some bullish continuation patterns (on the smaller timeframes) that bring us to some more immediate upside into Monday.
The expectation here is a move up to around 61. From there, if we see rejection we should be heading down to around 58.57.
The downside and upside targets are listed in the chart.
Its hard to play the PA in this market because its extreme greed that has a hallmark of random impulse selling and random rug pulls out of nowhere that complete in a day and lead to aggressive gapping up the next day. Its hard to really offer much insight in a safe fashion in this type of market.
However, the general "how its sposta work" is if we break over 61 and hold, we should be heading up to 63 ish range. Vs a 61 rejection or just hitting shy of 61 will bring us down to that 58 zone.
Not advice, its impossible to offer advice in these conditions anyway haha.
Safe trades!

IBIT – Bull Flag + Trend-Based Fib Targets Lined Up🔍 Price Action Setup
IBIT is forming a tight bull flag just beneath key resistance at $64 after a strong impulsive move off the $42.75 base. Structure remains bullish with price holding above the 20 EMA, and volume compression setting the stage for a breakout.
📈 Trend-Based Fibonacci Extensions
If this flag breaks, here's how the upside unfolds based on the trend-based Fib extension:
1.27 – $82.50
1.382 – $85.75 (Measured Move Target)
1.50 – $89.50
1.618 – $93.00 (Full Extension)
These levels align with the prior flagpole projection and market structure above. If bulls step in on volume, $85.75 becomes the logical first destination.
🌊 ETF Inflows Confirm the Narrative
IBIT has pulled in roughly $3.3B in recent inflows, leading the pack during a 12-day net inflow streak across spot Bitcoin ETFs. Institutions are clearly still positioning, and that's reflected in the tape. Tuesday alone brought $436M+ into spot Bitcoin ETFs.
₿ BTC Leading the Way
Bitcoin is holding strong above prior resistance and pushing higher. IBIT looks like it’s just waiting on a breakout confirmation to follow.
📌 Key Trade Levels
Breakout Trigger: Close above $64
Target Zone: $85.75 first, then extended to $93.00
Invalidation: Break below $56 structure
—
🧠 This is not financial advice — just a look at structure and flow through the DC Trading lens.
📲 Follow the journey on IG: @dc_trading_journey

iBIT - Weekly Volatility PotentialGood Morning!
Here is my weekly perspective for NASDAQ:IBIT
From when we reviewed last weekend, IV (41.19%) has lowered -2.23% and is entering the week with a 0% IVp. We have been in this pattern of rotating IV and Bi-Weekly volatility trends back and forth as HV10 (29.73%) entering the week has increased +1.49% from it's respective level entering last week. The prediction of what is to happen is contracting as what is actually happening in the short-term is trending up.
Bi-Weekly and Monthly volatility values after being 100% coiled and both putting in new yearly lows a month ago are starting to unwind as they create distance from those exact lows.
Could long-term trending means be on the horizon with quarterly values?
Bi-weekly trends will eventually find it's way back there with monthly not far behind, question is when. Our best advantage is to continue to track the data and ebb and flow with the markets and macro news as it is released.
Looking towards this next week, Our HV10 (29.73%) trending values are still contracting under our monthly HV21 (33.37%) trends, but IV (41.19%) although lowering beyond yearly lows, is reflecting future expansion.
Only time will tell, I think we will see another volume push into this week -- Remember to always be hedged and come back to join me next weekend as we review the charts for what happened VS our expectation!
CHEERS

iBIT - Weekly Volatility Snapshot Good afternoon -- Here is my weekly perspective for NASDAQ:IBIT
IV (43.42%) entering the week sits in the 6th percentile for the year. HV10 (28.24%) has been lowering towards it's yearly lows of 23.43% showing a coiling of bi-weekly values at 95.19% from this -- and a divergence from IV of -15.81% . IV is chasing the sinking bi-weekly volatility trends. We generally could see a volatility bounce within this range or continue to grind to new volatility lows.
I always expect and prepare for both, Lewis Pastor once said, "in a scientific setting, chance favors the prepared mind". I hold that true in a lot of situational settings not just scientific, but find it to be very true with BITSTAMP:BTCUSD volatility and risk management.
Moving deeper into the week; what can we expect?
Well, I think that the final shakeout may be here as we consolidate more into the beginning of the week finalizing on Tuesday, June 3rd. I find significance on this date being the extension in time from selling off for 45 days after the initial 'W' distribution off the top -- potentially the start of the volatility swing back towards long-term trending means and maybe the start of another impulse run to track into..stay tuned to find out in observation.
If this week we find regression to HV63 (49.26%), it will be a swift and quick move showing lots of strength. The ability to capture premium between the difference of stated IV from lowering HV10 values to the volatility swing back up above IV to quarterly means, is what it is all about ! This capture can be upwards 5.84% as a volatility metric read and beyond, because when a volatility regression occurs, it moves past means until having to consolidate back downwards again. Rinse and repeat.
For those interested in volatility analysis and the application of weighted HV ranges to IV, I encourage you to BOOST and share this post, leave a comment, or follow me to join me on this journey.

IBIT — Ishares Bitcoin Trust. Under Bearish PressureThe iShares Bitcoin Trust ETF (IBIT) has been a mixed performer year to date, with its price up and down around 20 percent this year and currently tracking for low double-digit returns in 2025.
The ETF currently trades around $59.36–$60.40, with assets under management of around $68 billion and a 0.1 percent premium to net asset value (NAV).
1-Hour Technical Outlook
On the 1-hour time frame, technical indicators are mixed but generally bearish:
Moving Averages: Short-term moving averages (e.g. 200-hour SMA/EMA) are currently signaling a Sell signal as the price moved below these averages in late May.
Support and resistance: The ETF faces resistance around $61, corresponding to the broken 200-hour SMA, and support around $54, with stronger volume-based support around $47, corresponding to the beginning of the April rally.
RSI indicator: Over the last 20 days, the RSI(55) indicator has already been briefly noted below the baseline of 50, highlighting the need for more active risk management, since, as we can see from the chart, the indicator has again moved into the risk zone in late May and early June (where it currently remains), accordingly, for a longer term.
Volatility: During the recovery period in April-May 2025, the ETF demonstrated moderate intraday volatility (with half the 200-hour sigma value (σ) of about 3.5 percent), while the 20-hour decline on May 22-23, which exceeded this value, has provided at that time clear arguments for more active risk management.
To summarize, we can say that NASDAQ:IBIT is experiencing a pullback, technical indicators point to local persistence of bearish sentiment, following the classic, empirically proven adage of the financial market "Sell in May - and Go away."
--
Best wishes,
@PandorraResearch Team

iBIT - Weekly Volatility SnapshotGood Afternoon,
Here is my weekly perspective for NASDAQ:IBIT ---
IV (48.31%) entering this week is holding in the 24th percent range for the year and has been climbing weekly from putting in new lows at the beginning of the year. We essentially have been seeing rising IV with rising price action, the best of the best. Premium increases from price action climbing and IV rising affects Vega positively increasing premium too.
Bi-weekly trends (27.64%) show a cooling off entering the week and contraction under IV, but it might not last long as there could be major macro news in the crypto world at any moment. This could be a big week on continued regression towards quarterly means (51.52%).
If this happens the range will continue to expand in my option and hold a +3.21% value per move on premium over stated IV, but weekly trends would be expanding 23.89% -- A huge move.
As always --
For those interested in volatility analysis and the application of weighted HV ranges to IV, I encourage you to BOOST and share this post, leave a comment, or follow me to join me on this journey.

IBIT aka BITCOIN TOPPING I am moving into In the money PUTS The chart of Blackrock bitcoin ETF needs only one minor new high to reach a projection and to complete The EW pattern from the low to mark in the bullish wave count wave 1 of Super Cycle blowoff this is a 5 % View . The 95 % is the WAVE B Top as we saw at every major peak see 2024 dec 8th forecast for bitcoin and spy Cyles as well as SPIRALS have now entered the window of A major turning point In which I am once again as I shorted bitcoin in ibit at 61 I have taken a65 % short and will move to a 100 % by friday if we can have any rally above the last high to end 5 clean waves Best of trades WAVETIMER

Why I Use Covered Calls: Monthly Income, StrategyDescription:
In this video, I break down why I use covered calls as part of my long-term investing strategy—especially inside tax-advantaged accounts like Roth IRAs. Whether you're looking to generate steady monthly income, reduce downside risk, or are open to selling your stocks at a premium, covered calls can be a powerful tool.
🧠 What You'll Learn:
Why covered calls are ideal for long-term holders who want extra income
The basic requirements (100 shares, option approval, etc.)
Why volatile stocks yield better premiums than dividend stocks
My personal method: targeting 0.20 delta strike prices on a monthly timeframe
Risks like being assigned and limiting your upside
💡 Key Takeaway:
If you’re not using a tax-advantaged account, your capital gains are taxable—so consider strategies like this inside an IRA.
📌 Coming Soon:
In a future video, I’ll dive into the Wheel Strategy and selling puts to generate income from cash reserves.

iBIT Weekly PotentialVolatility, expressed through standard deviation, quantifies market elasticity and presents a level of probability and precision that humbles us all.
Now we move on to the world of BTC with a look at NASDAQ:IBIT
Here, as we have been observing an ongoing regression, you see that HV10 has expanded past HV21 and now IV is predicting more range expansion leading toward the volatility at quarterly means. Stay tuned, and I hope this helps visualize what I do.
BOOST the post, drop a follow and comment, BUT don't forget to circle back at the end of the week to revisit and observe how our trending markets preformed!

IBITUSDT | Volume Speaks FirstRight now, IBITUSDT is showing more volume than even Binance’s pair . That alone tells me where the real activity is — and this is the chart I’ll be tracking .
I’m not interested in premature entries. I’ll be watching below the green line for potential setups , but only with clear confirmation on lower timeframes.
“I will not insist on my short idea. If the levels suddenly break upwards and do not give a downward break in the low time frame, I will not evaluate it. If they break upwards with volume and give a retest, I will look long.”
Most traders follow the noise. I follow the volume. That’s how I stay accurate.
📌I keep my charts clean and simple because I believe clarity leads to better decisions.
📌My approach is built on years of experience and a solid track record. I don’t claim to know it all but I’m confident in my ability to spot high-probability setups.
📌If you would like to learn how to use the heatmap, cumulative volume delta and volume footprint techniques that I use below to determine very accurate demand regions, you can send me a private message. I help anyone who wants it completely free of charge.
🔑I have a long list of my proven technique below:
🎯 ZENUSDT.P: Patience & Profitability | %230 Reaction from the Sniper Entry
🐶 DOGEUSDT.P: Next Move
🎨 RENDERUSDT.P: Opportunity of the Month
💎 ETHUSDT.P: Where to Retrace
🟢 BNBUSDT.P: Potential Surge
📊 BTC Dominance: Reaction Zone
🌊 WAVESUSDT.P: Demand Zone Potential
🟣 UNIUSDT.P: Long-Term Trade
🔵 XRPUSDT.P: Entry Zones
🔗 LINKUSDT.P: Follow The River
📈 BTCUSDT.P: Two Key Demand Zones
🟩 POLUSDT: Bullish Momentum
🌟 PENDLEUSDT.P: Where Opportunity Meets Precision
🔥 BTCUSDT.P: Liquidation of Highly Leveraged Longs
🌊 SOLUSDT.P: SOL's Dip - Your Opportunity
🐸 1000PEPEUSDT.P: Prime Bounce Zone Unlocked
🚀 ETHUSDT.P: Set to Explode - Don't Miss This Game Changer
🤖 IQUSDT: Smart Plan
⚡️ PONDUSDT: A Trade Not Taken Is Better Than a Losing One
💼 STMXUSDT: 2 Buying Areas
🐢 TURBOUSDT: Buy Zones and Buyer Presence
🌍 ICPUSDT.P: Massive Upside Potential | Check the Trade Update For Seeing Results
🟠 IDEXUSDT: Spot Buy Area | %26 Profit if You Trade with MSB
📌 USUALUSDT: Buyers Are Active + %70 Profit in Total
🌟 FORTHUSDT: Sniper Entry +%26 Reaction
🐳 QKCUSDT: Sniper Entry +%57 Reaction
📊 BTC.D: Retest of Key Area Highly Likely
📊 XNOUSDT %80 Reaction with a Simple Blue Box!
📊 BELUSDT Amazing %120 Reaction!
📊 Simple Red Box, Extraordinary Results
I stopped adding to the list because it's kinda tiring to add 5-10 charts in every move but you can check my profile and see that it goes on..

IBIT 24hr potterbox. I drew this box to include the low that went to $43.17 It went to that and turned things around. someone said it wouldnt go any lower than $47.00 well it went that low and lower. This box shows that ibit is above the 50 percent line . Its above the 200 day moving average. which some people consider this a buying zone. personally i bought when everthing was down because i knew this market would come back like it has. Make your own decisions about this, but I grab as much as i can because this market isnt going anywhere. I am in my 50s and the market is still here. Buy quality stocks such as Apple ,Amazon and tesla and so on. you have to ask your self why is this market down , the companys are stll growing, such as apple. well happy trading.

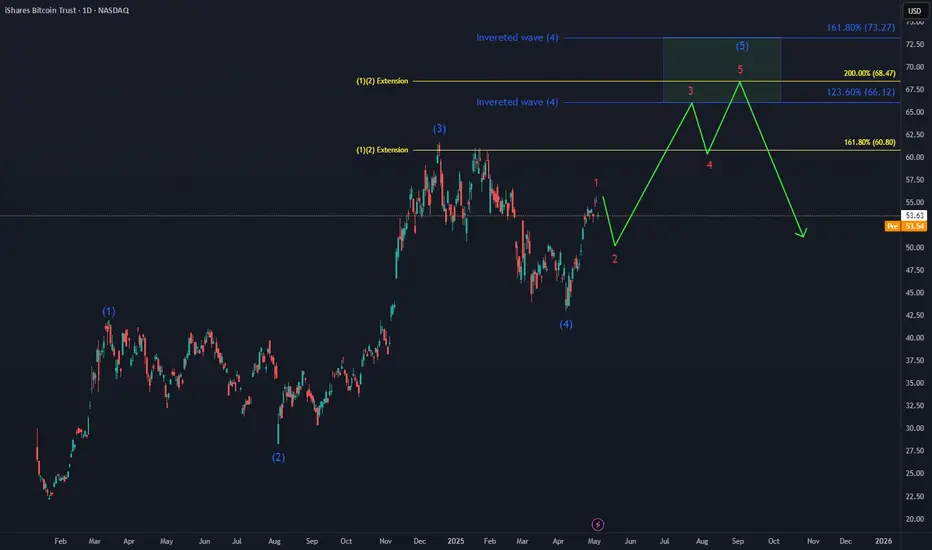
Bitcoin ETF IBIT Next TargetThe Bitcoin INDEX:BTCUSD ETF NASDAQ:IBIT is shaping a 5-wave move toward a new ATH, set to complete its cycle within a regular impulse.
Key technical area for the next move higher:
🔵 Inverted wave (4) target : $66 - $73
🟡 Wave (1)(2) extension : $68