Bottom x 4 vs. TriangleBuy - Sell? Good question , no matter how you decide, fact is, that we now are trading near a clear action Point: The three times tested support level @ ~ 130$
2 Trades are thinkable:
Buy the support @ 130 --> exspected TPs: 149 / 165
Sell the Break of the Tringle-Support @ 127-130 - exspected TP:100
ILMN trade ideas

ILLUMINA - Long from necklineA massive H&S pattern on the weekly chart, with a double bottom and double divergence right at the neckline. As of this week, the impulse is blue.
On the daily chart, the double bottom is more obvious. The right time to enter was right after earnings, where Illumina recovered all the overnight losses and closed up for the day. Still, the RRR is acceptable even today.
I would trade this stock as follows: Go long with a stop below the earnings day, with a target for at least half the position just below the 78.6 retracement. The remaining position should be kept in case this proves to be a failed H&S pattern.

Illumnia in channel $136-$142Price failed above previous high of the day. Entry on break of $140 with target at $136

ILMN gaped down in front of major support (Daily timeframe)Fundamentals:
Illumina-1.38% made a disappointing start to first-quarter 2016 missing the estimates. Also, rising costs has potential to hamper its growth significantly. This rise in higher operating expenses impacted Ilumina’s cash flow reserve in the reported quarter.
Technicals:
In the mid of summer 2015 the price of stock accelerated with top $242. But big, engulfing, bear candle ended this run to the sky. Then it broke major trend line and deeper correction started. Then, it built sereis of lower highs, which mean that bear are in control. And now, we are sitting in front of major support $130 after dissapointing earnings.
Trade Management:
Break down of major support at $130 and hold below for a few days will trigger Short Entry. Shouldn't go back above $144, otherwise it will be break out failure. Respective Target is $100, which make this trade attractive from Risk/Reward point of view (1:2).
Market:
$IBB - ETF14.29% for bios is underperforming the market. And overall market ($SPY) is building Head&Shoulders pattern (now, we are in right shoulder). That also supports this idea.

ILMN showing weakness in front of major support Fundamentals:
Illumina made a disappointing start to first-quarter 2016 missing the estimates. Also, rising costs has potential to hamper its growth significantly. This rise in higher operating expenses impacted Ilumina’s cash flow reserve in the reported quarter.
Technicals:
In the mid of summer 2015 the price of stock accelerated with top $242. But big, engulfing, bear candle ended this run to the sky. Then it broke major trend line and deeper correction started. Then, it built sereis of lower highs, which mean that bear are in control. And now, we are sitting in front of major support $130 after dissapointing earnings.
Trade Management:
Break down of major support at $130 and hold below for a few days will trigger Short Entry. Shouldn't go back above $144.50, otherwise it will be break out failure. Respective Target is $92, which make this trade attractive from Risk/Reward point of view.
Market:
$IBB - ETF for bios is underperforming the market. And overall market ($SPY) is building Head&Shoulders pattern (now, we are in right shoulder). That also supports this idea.


Illumina Bearish Pullback to Fifty Day Moving AverageIllumina (ILMN) advanced over 400% from its’ 2013 cup and handle breakout before forming a bearish head and shoulder top in 2015.
Illumina broke down below the head and shoulder neckline, in heavy volume, in September 2015, and dropped approximately 30%, and has spent the last six months consolidating that drop, and shaking out the early bears.
Over the last seven weeks Illumina has pulled back to the fifty day moving average, in light volume, as the market attempts to rally. This is the third time the stock has attempted to rally over the fifty day moving average. Each attempt has been met with heavy volume selling back down through the fifty day moving average.
Illumina can be shorted here as it stalls at the fifty day moving for the third time and breaks below it in heavier volume.


Bullish Ascending Triangle Break Out Confirmed for $ILMN Dear Fellow Risk Takers,
Here's an update on the ILMN Break out idea.
Updates includes>
i) Confirmation that breakout is now confirmed
ii) New price target
Price of Illumina (ILMN) has been rising in an accelerated trend, between Feb 2013 to Feb 2014.
Price has risen from around $50 to $180 during this accelerated uptrend period.
As with all accelerated (parabolic) chart pattern, price corrected sharply to around $130 (about -27% from high of $180) and consolidated sideways from Feb 2014 to Oct 2014.
This consolidation forms an Ascending Triangle pattern with a minor breakout above $180 on around 2014-10-21.
Triangles are essentially continuation patterns, so therefore the breakout indicates intention to continue the bullish trend.
After the minor breakout of the Triangle pattern, Contrarian traders tried to trade against the trend and forced out a false breakout of the triangle pattern.
However we can note that there is support buying right above the breakout level of $180 and the tide is turning against the contrarians.
This also means that possible stop loss orders, of these traders who are currently short, may fuel price momentum higher.
The moment the market is convinced $180 support will hold, there is no where else for price to go, but upwards.
If we trace a line against the last 3 significant price lows, we can see a potential accelerated price pattern forming as well.
This means that there is a possibility of a sharp vertical movement in price, if the price intends to trade higher.
Based on all the points , , and since price has closed above significant price level of $200, we project that price is likely to trade higher.
Also, there is a chance of price trading higher in an accelerated fashion, as mentioned in .
Breakout has been confirmed and Entry can be made, as long as price is above $198.00.
Reason: If you put yourself in the shoes of a contrarian trader who are currently short, it is logical for you to place a reasonable stop loss just after $200.
Therefore triggering of short stop loss orders above $200 plus breakout buying and will likely drive momentum for price to "lift off"
Below $190.
Price Target: 230.00
This is simply the theoretical measure of the Ascending Triangle Chart Pattern.
Therefore we can consider taking partial profits along the way, if price manages to trade and accelerate higher.
Another Technical profit taking guide will be to take partial profit each time RSI(14) crosses 81.
You can look back at the RSI(14) vs the Price, between 2014-01-13 to 2014-02-24, to get an idea on how to execute this method.
As always, there is always a risk of a false breakout, gets sharply resisted and trade back down to stop loss level.
There is a risk that the Earnings Release on Jan 27 2015 may severely affect the price in a negative way.
Lastly, as price may trade in an accelerated price pattern, it is likely that price will correct sharply (mentioned in ) when buying momentum cannot be sustained.
Therefore it might be prudent to accept that we can never capture 100% of the up move and be contented to take partial profit along the way.
Triangles Chart Pattern: thepatternsite.com
Example of Sharp sell-off After Acceleration: farm4.staticflickr.com
Accelerating Price Chart Pattern> blog.forex4you.com
Using Support and Resistance Levels of Relative Strength Index> Technical Analysis for the Trading Professional by Constance Brown, Chapter 1: Oscillators Do Not Travel between 0 and 100.
Like it, Share it, Follow it~
Trading View: BreakOutArtist
StockTwits: stocktwits.com/BreakOutArtist
TradeHero: BreakOutArtist

Turn the Tide Against Contrarians who are Short $ILMNDear Fellow Risk Takers,
Here's a price chart where in one quick glance, it is clear where the price is very likely to trade, going forward.
Regardless, it is still prudent to do our due diligence and work out the details>
Price of Illumina (ILMN) has been rising in an accelerated trend, between Feb 2013 to Feb 2014.
Price has risen from around $50 to $180 during this accelerated uptrend period.
As with all accelerated (parabolic) chart pattern, price corrected sharply to around $130 (about -27% from high of $180) and consolidated sideways from Feb 2014 to Oct 2014.
This consolidation forms an Ascending Triangle pattern with a minor breakout above $180 on around 2014-10-21.
Triangles are essentially continuation patterns, so therefore the breakout indicates intention to continue the bullish trend.
After the minor breakout of the Triangle pattern, Contrarian traders tried to trade against the trend and forced out a false breakout of the triangle pattern. However we can note that there is support buying right above the breakout level of $180 and the tide is turning against the contrarians.
This also means that possible stop loss orders, of these traders who are currently short, may fuel price momentum higher.
If we trace a line against the last 3 significant price lows, we can see a potential accelerated price pattern forming as well.
This means that there is a possibility of a sharp vertical movement in price, if the price intends to trade higher.
Based on all the points , and , we project that price is likely to trade higher.
Also there is a chance of price trading higher in an accelerated fashion, as mentioned in .
Enter Long when market can convincingly close above $198.00.
If you put yourself in the shoes of a contrarian trader who are currently short, it is logical for you to place a reasonable stop loss just after $200.
Hence the intention of this entry condition is to enter just before the avalanche of buying momentum are triggered above $200.
Below $190.
To be honest how high the price can go is anyone's guess.
However we can say that price is likely to at least try to reach for the psychological significant price of $250.
Therefore we can consider taking partial profits along the way, if price manages to trade and accelerate higher.
Another Technical profit taking guide will be to take partial profit each time RSI(14) crosses 81.
You can look back at the RSI(14) vs the Price, between 2014-01-13 to 2014-02-24, to get an idea on how to execute this method.
As always, there is always a risk of a false breakout, where price rises to $200, gets sharply resisted and trade back down to stop loss level.
There is a risk that the Earnings Release on Jan 27 2015 may severly affect the price in a negative way.
Lastly, as price may trade in an accelerated price pattern, it is likely that price will correct sharply (mentioned in ) when buying momentum cannot be sustained.
Therefore it might be prudent to accept that we can never capture 100% of the upmove and be contented to take partial profit along the way.
Triangles: A Short Study In Continuation Patterns> www.investopedia.com
Example of Sharp sell-off After Acceleration: farm4.staticflickr.com
Accelerating Price Chart Pattern> blog.forex4you.com
Using Support and Resistance Levels of Relative Strength Index> Technical Analysis for the Trading Professional by Constance Brown, Chapter 1: Oscillators Do Not Travel between 0 and 100.
Like it, Share it, Follow it~
Trading View: BreakOutArtist
StockTwits: stocktwits.com/BreakOutArtist
Twitter: twitter.com/BrkOutArtist
TradeHero: BreakOutArtist
Facebook: www.facebook.com

ILMN, ambushing for a shortILMN, one of the healthcare stock that helps push ETF such as IBB, XLV & etc to ATH has this interesting observation.
Whenever the price makes higher highs while RSI makes lower lows, decent correction ensues.
And there you are, we are having another potential bearish RSI divergence again. I reckon there is still some room for upside before price hit the resistance of upper rising wedge around 200. Once shorted, my potential targets are ~133 and ~76.


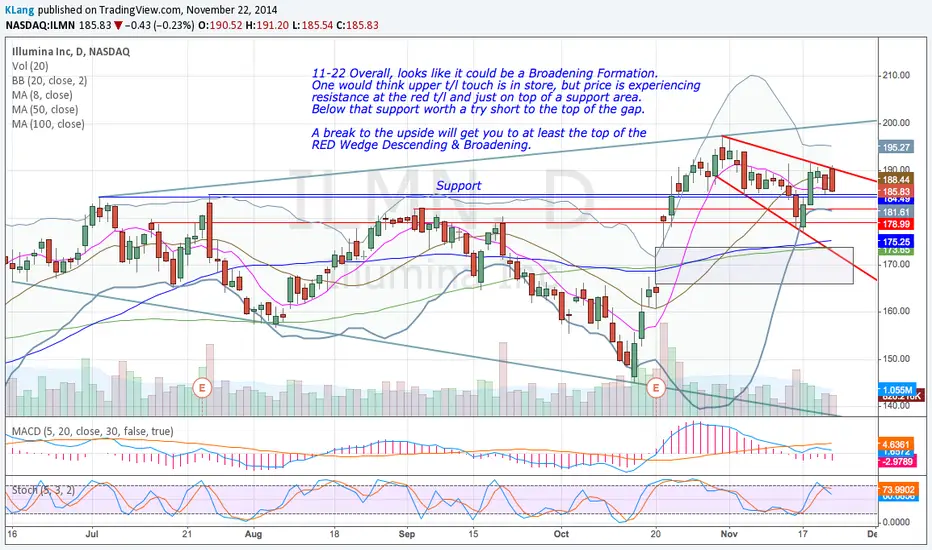


ILMNNotes on chart. Potential for HS, but neckline is previous support. Should it break, target is just inside the top of the gap.

Illumina - Breaking downEntering in the direction of the weekly trend. This stock appeared like it made a false downside breakout but that was cleared and probably a strong fall will follow. Check the weekly chart below!
The entry prices are supposed to be at the last price on the chart. The reason for which they are not is that price was falling so fast, until I hit the publish button Illumina lost another 0.50%.


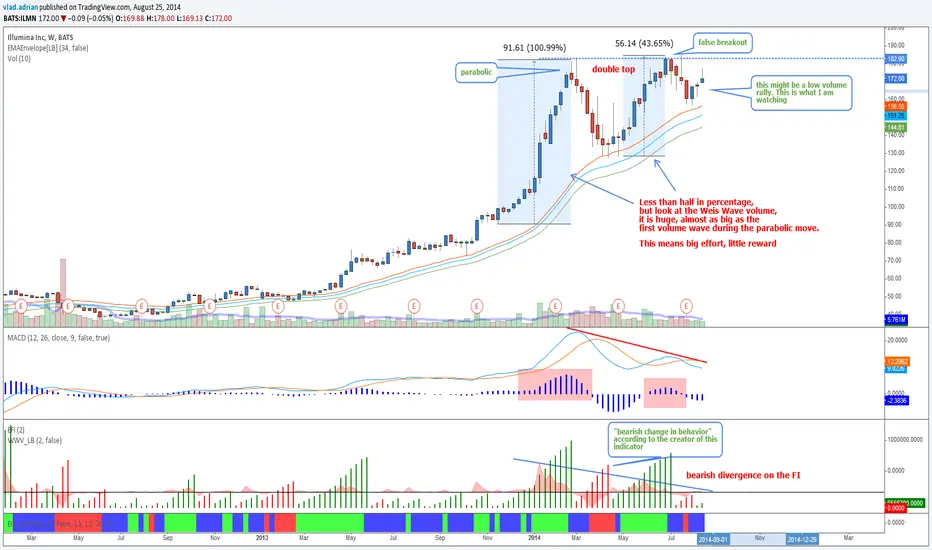
Illumina - Weekly chart setting up for a downtrendI saw a few of weeks ago a chart of this stock posted by another user, and it looked very bearish. The correction was pretty light, when you have such a divergence on a double top heavy corrections follow. I believe that shorting this stock is the way to go. The double top is still there, the divergence on the MACD and FI is still there. The pattern on the Weis Wave is bearish. Right now I believe we are rallying on little demand, and entering is tricky. If I could, I would buy a put option, cause I'm not sure with the timing. I believe lower prices are coming during the following months.