INSG (PRICE ACTION) RETRACEMENT AND BREAKOUT|PRICE ACTION|
ISNG price spikes consistently at 6 AM Standard Pacific Time and retraces for most of the day. Price has just hit resistance level at around 18 and will most likely retrace until 16, possibly lower. Floor support price is set around 13.90 and price has not broke down below it apart from JAN 6, support floor will most likely continue. MACD also show great momentum on the 1 hour time frame which means that it will most likely reverse soon. The MACD on the higher 4 hour time frame has just crossed signal line indicating likely hood in upward momentum on the higher 4 hour time frame.
(I am aware the support/resistance levels are free handed and have not been adjusted)
INSG trade ideas

INSG bullishThe chart doesn't look as possible head and shoulders anymore.
Breaking out from the downtrend, bousing from a strong support

$INSG is going to breakout.active Pennant spotted with PoC at $14.38. Volume looks positive, Stoch oversold about to cross.


5G unitWOW wall street is on this like a Dog with a bone nice Day nice strong finish with volume. Hoping for a continuation tomorrow hello 20 in a week?


INSG CHANNEL And Trend Based Fib ExtensionExpecting next week sideways action to continue, with the thought that 16.50 (0.618 fib) will hold as support as well as the 30min kumo cloud. A larger move is expected in the first half of Jan with a price target of 21.50ish.

nice trend channel on this chartstill has a couple weeks of upside before we see a big pullback imo, target 22-25 and use a tight stop! goodluck :)

5G INSGFlag pattern taking shape for a Bull flag trend looks promising at discount why not Hot under cover.

$INSG confirmation massive bullish move 50+% in <2weeksMassive confluence of indicators which gave the strong buy signal followed by explosive move. See indicator signals on the chart.
My Watchlist is performing really well.

INSG Inseego is setting up for the next run.. paying attention?Quick analysis on INSG Inseego the hot tech company deploying 5G hotspots with major telcos like Verizon.
Yes the stock has had a great run, but it's clearly got momentum and the fundamentals are strong. We are tracking an upward channel with a downward-facing wedge if you zoom in close. If the lines I drew are generally in the right spots, then we're seeing a breakout to the upside slowly creep and before anyone realizes this stock is likely to retest it's all-time highs again.
I'm bullish on 5G, so I love names like Inseego which are actually deploying hardware in the market and making headlines around strong performance.
What's your thought? Is my 5G bull bias blinding me or is the chart showing us what I'm seeing?

$INSG nice pop in a week - straight from watchlistBought at $10.17, Nice 22% move in 7days.
Lots of technical indicators converged there - MAs, Ichimoku Cloud and as shown here the Fib 0.618 retracement a few days earlier.


$INSG Inseego Corp 5G trade
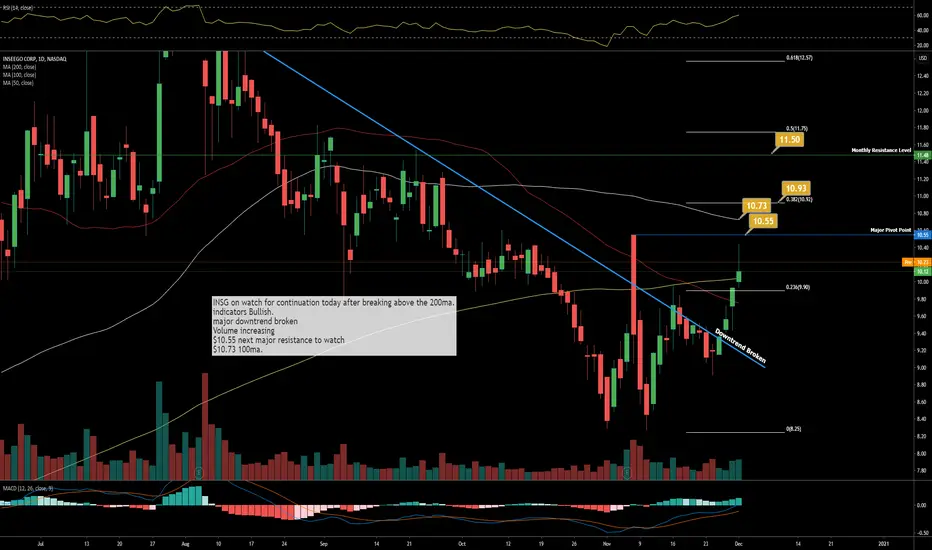
INSG on watch for continuation today after breaking above the 200ma.
indicators Bullish.
major downtrend broken
Volume increasing
$10.55 next major resistance to watch
$10.73 100ma.
$INSG Inseego Corp Trade setup
Potential entry above the 200 & 50ma's $10.05
target price $10.88 below 100ma
Undervalued 5G stock.


I LIKE INSG13 day parabolic sequence capitulation
Jim Cramer: “I like Inseego , I like Inseego, I like Inseego”

INSG ER run upIf history repeats itself INSG is looking for another nice ER run up to $15 lvl as it had done the last two ER, hard support at the $9.60 lvl.

Higher Supports for $INSG in Range Indicate Upside BreakoutThe range is wide so may take some time to breakout.

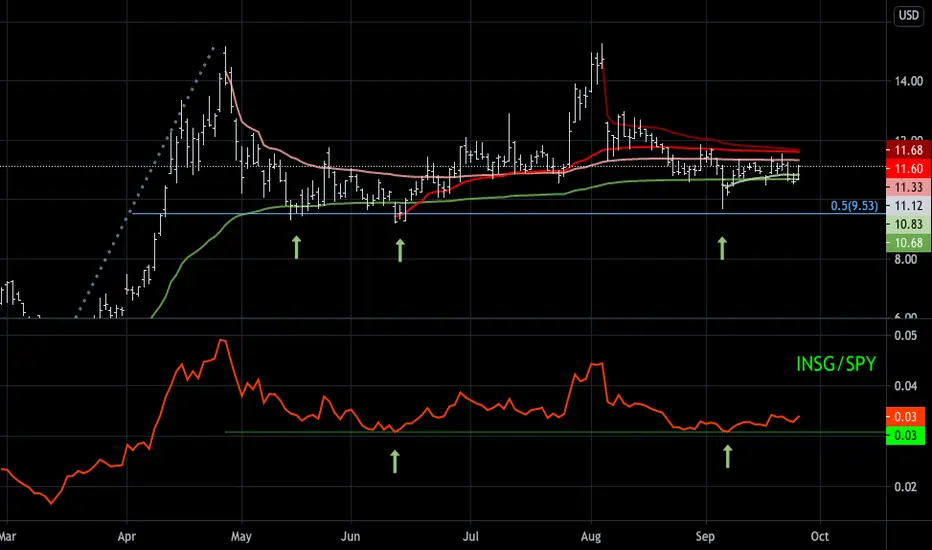
INSG avwap 'squeeze' should resolve to upside-INSG currently trades between VWAPs from significant YTD highs and lows, the tightening range of these VWAP lines creates a 'squeeze' like a tightening bollinger band or similarly a TTM squeeze, which signals a current decrease in price range and an increase in volatility is to come
Why I expect this increase in volatility to occur to the upside:
-50% retracement: INSG has consistently found support at the 50% retracement from the move higher off the March low
-Support in INSG/SPY: INSG finding support in relative performance to SPY was a prior predictor of ensuing outperformance vs. SPY, and having recently reacted higher from support, I expect outperformance to resume
Conclusion: tightening price range shown by anchored VWAP squeeze and a reversal higher in SPY relative performance point to an imminent upside breakout
INSG's weekly chart shows a consolidation pattern for 21 weeks.I anticipate an upward breakout out of the trading range because:
-price increases with higher volume and decreases on lighter volume
-higher support level as range develops
-larger trend is up for the market
Buy zone in the area of the new support level or following breakout and close above the range.
I'd hold for a few months to a year.

$INSG 5G trade in Inseego Corp
Possible trade in this under the radar 5G company.
Alert set for break above $15.20
Potential upside targets $ 17.50 - $18.96
HAs been considerable action in the options market with a bullish outlook.
PLEASE GIVE US A LIKE IF YOU FIND OUR CONTENT HELPFUL, THANK YOU.

Testing Suppory trendlineAdding more to position if holds above $13.50. Regardless Im long hodl on my current position no stop loss
