IXIC trade ideas


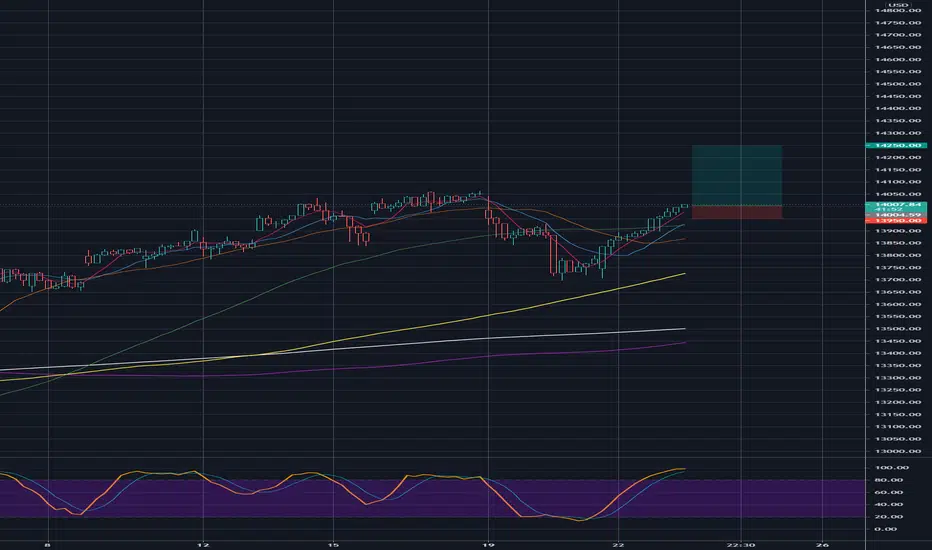
Always wait for confirmation, I'm whatching the NASDAQ $IXICThat's what I have been doing for the last few weeks. I sold almost all my positions and I'm mostly in cash now. I can see the Nasdaq TVC:IXIC is forming a second base in the bull market that began in April of 2020. History can tell that this is just another rest before the next bull run in the long term trend. This base is very similar at the last one formed from September to November os 2020. Right now I'm cautios as I look for leaders.
Last week tested its 50 day moving average and it held, today history repeats so I'm still waiting for better conditions before I get agressive. I'm being very selective looking for good relative strength to add stocks in my watchlist. Right now I have NYSE:DAR , NASDAQ:CBNK and NYSE:YETI to name a few.

Nasdaq Analisys 2021-05-10The Algotrading Multiday system is: short from May 4, 2021 from 13633.5
position performance: 0.40%
YTD performance: 10.29%
1 year performance: 41.53%
At the end of the day: maintain position
Graphic Analysis
Currently the prices are testing the support 13600, if in close the level holds then tomorrow it could rebound, otherwise there is a risk of going to test the lower band of the medium / long-term bullish trend line
I recommend observing, discussing, but as always for the operation always use your head !!

Market Week in Review - 5/3/2021 - 5/7/2021
Summary: The market is the great fortune teller, always trying to price in the future, not the present. We saw that in action this week in several ways. The first was with Janet Yellen's comments on Tuesday that interest rate hikes might be needed in the future. That sent investors into a frenzy sell-off before she walked back the comments.
Notes
The Market Week in Review is my weekend homework where I look over what happened in the previous week and what might come in the next week.
I do occasionally have some errors or typos and will correct them in my blog or in the comments on TradingView. I do not have an editor and do this in my free time.
If you find this helpful, please let me know in the comments. I am also more than happy to add new perspectives and data points if you have ideas.
The structure is the following:
A recap of the daily updates that I do here on TradingView.
The Meaning of Life, a view on the past week
What's coming in the next week
The Bullish View, The Bearish View
Key index levels to watch out for
Wrap-up
If you have been following my daily updates, you can skip down to the “The Meaning of Life”. If not, then this first part is a great play-by-play recap for the week. Click the daily charts for more detail on sectors, indexes and market leaders each day.
-=x=-=x=-=x=-=x=-=x=-=x=-=x=-
Monday, May 3, 2021
Facts: -0.48%, Volume lower, Closing range: 8%, Body: 85%
Good: Held above the 21d EMA
Bad: Lower high, lower low, could not stay above 14,000
Highs/Lows: Lower high, lower low
Candle: Thick red body with small upper and lower wicks
Advance/Decline: Slightly more declining stocks than advancing stocks
Indexes: SPX (+0.27%), DJI (+0.70%), RUT (+0.49%%), VIX (-1.61%)
Sectors: Energy (XLE +2.75%) and Materials (XLB +1.49%) were top sectors. Communications (XLC -0.53%) and Real Estate (XLRE -0.54%) were bottom.
Expectation: Sideways or Lower
The cyclical sectors soared. The others did not. A rotation into reopening and cyclical stocks played well for all the major indexes except the Nasdaq which is heavy in big-tech and growth stocks.
The Nasdaq closed down -0.48% on lower volume. A brief rally attempt in the morning brought the index above 14,000 before selling off and testing the 21d EMA several times before closing just above the intraday lows. The thick red body covers 85% of the candle is surrounded by a short upper and lower wick with a closing range of 8%. There were slightly more declining stocks than advancing stocks.
-=x=-=x=-=x=-=x=-=x=-=x=-=x=-
Tuesday, May 4, 2021
Facts: -1.88%, Volume higher, Closing range: 37% (w/gap), Body: 45%
Good: Bounced off 50d moving average line
Bad: Gap down on news, high volume distribution
Highs/Lows: Lower high, lower low
Candle: Thick red body in upper half of candle, long lower wick
Advance/Decline: Almost four declining stocks for every advancing stock
Indexes: SPX (-0.67%), DJI (+0.06%), RUT (-1.28%), VIX (+6.39%)
Sectors: Materials (+1.09%) and Financials (XLF +0.80%) were top. Consumer Discretionary (XLY -1.04%) and Technology (XLK -1.79%) were bottom.
Expectation: Sideways or Lower
The market sold off sharply at open after comments from Janet Yellen suggested that interest rates might need to increase to keep the economy from overheating. Investors fled sectors more sensitive to interest rate hikes and rotated into the cyclical sectors.
The Nasdaq opened with a gap-down and closed the day with a -1.88% decline on much higher volume. The index continued to decline after open until it hit the 50d moving average and found support through the afternoon. The result is a long lower wick underneath a 45% red body and a 37% closing range, considering the gap as part of the range. There were nearly four declining stocks for every advancing stock.
-=x=-=x=-=x=-=x=-=x=-=x=-=x=-
Wednesday, May 5, 2021
Facts: -0.39%, Volume lower, Closing range: 13%, Body: 76%
Good: Lower than average volume
Bad: Lower high, thick red body from afternoon decline
Highs/Lows: Lower high, higher low
Candle: Inside day, thick red body with similar small upper and lower wicks
Advance/Decline: Two declining stocks for every advancing stock
Indexes: SPX (-0.37%), DJI (+0.29%), RUT (-0.31%), VIX (-1.69%)
Sectors: Energy (XLE +3.23%) and Materials (XLB +1.27%) were top. Real Estate (XLRE -1.47%) and Utilities (XLU -1.69%) were bottom.
Expectation: Sideways or Lower
This is not the rally we are looking for. The Dow Jones Industrial average closed at a record high today while the rest of the market struggled to hold any gains, with the Nasdaq and Russell 2000 falling further behind the other major indexes.
The Nasdaq closed with a -0.39% loss for the day on lower than average volume. The 13% closing range is under a 76% body with a short lower wick created from a late afternoon dip. The short upper wick was formed just after open before the bears took over. There were two declining stocks for every advancing stock.
-=x=-=x=-=x=-=x=-=x=-=x=-=x=-
Thursday, May 6, 2021
Facts: +0.37%, Volume higher, Closing range: 99%, Body: 38%
Good: High closing range with gain on higher volume
Bad: Lower low with dip below 50d moving average
Highs/Lows: Lower high, lower low
Candle: Hammer with long lower wick and smaller body in upper half of candle
Advance/Decline: Almost three declining stocks for every advancing stock
Indexes: SPX (+0.82%), DJI (+0.93%), RUT (+0.00%), VIX (-3.97%)
Sectors: Financials (XLF +1.49%) and Consumer Staples (XLP +1.29%) were top. Consumer Discretionary (XLY -0.22%) and Health (XLV -0.13%) were bottom.
Expectation: Sideways or Higher
Another record was set for the Dow Jones Industrial average while value stocks continue to outpace growth stocks. Two intraday rallies might just be the action the Nasdaq needed to join the rally, but the gains were mostly isolated to the mega-caps.
The Nasdaq closed with a +0.37% gain on higher volume. The mid-day rallies formed a long lower wick with a smaller 38% green body in the upper half of the candle, forming a hammer. A hammer can signal a trend reversal but needs to be confirmed the following day. The closing range of 99% comes after a rally late in the afternoon.
-=x=-=x=-=x=-=x=-=x=-=x=-=x=-
Friday, May 7, 2021
Facts: +0.88%, Volume lower, Closing range: 60% (w/gap), Body: 21%
Good: Higher close, higher high, higher low, confirmation of yesterday's hammer
Bad: Lower volume, gap-up may need revisiting
Highs/Lows: Higher high, higher low
Candle: Longer upper wick over a thin green body in lower half of candle, gap-up at open
Advance/Decline: About three gaining stocks for every declining stock
Indexes: SPX (+0.74%), DJI (+0.66%), RUT (+1.35%), VIX (-9.24%)
Sectors: Energy (XLE +1.78%) and Real Estate (XLRE +1.22%) were top. Utilities (XLU +0.30%) and Consumer Staples (+0.00%) were bottom.
Expectation: Sideways or Higher
More records were set as the S&P 500 and Dow Jones Industrial average both had record closes while the Nasdaq and Russell 2000 joined the rally, also making gains. Employment data in the morning caused the dollar to fall which can give a boost to mega-caps and growth stocks.
The Nasdaq closed with a +0.88% gain. Volume was lower and the morning rally faded through the day, giving the candle a 60% closing range (including the gap) and a thin 21% body under a long upper wick. Nonetheless, the positive gain with a higher high and higher low is a confirmation of the previous day's reversal hammer candle. There were three gaining stocks for every declining stock.
-=x=-=x=-=x=-=x=-=x=-=x=-=x=-
The Meaning of Life (View on the Week)
The market is the great fortune teller, always trying to price in the future, not the present. We saw that in action this week in several ways. The first was with Janet Yellen's comments on Tuesday that interest rate hikes might be needed in the future. That sent investors into a frenzy sell-off before she walked back the comments.
The second indication of future focus was that investors were much more focused on the guidance in earning reports than they were on the current results. Earning reports that beat expectations, but lowered or kept guidance the same were punished. Earnings reports that didn't meet expectations, but could provide higher guidance were rewarded.
But possibly the biggest indication is the rotation from the growth stocks of the past year, to the value re-opening and infrastructure stocks of this year. While the Dow Jones industrial average (DJI) and S&P 500 (SPX) were setting new records, the Nasdaq (IXIC) was still dropping, dipping below its 50d MA before finding any support. It was nearly the same for small-caps and the Russell 2000 (RUT).
Thursday was the pivot day for both the Nasdaq and RUT, with long lower wicks and high closing ranges. The rally continued into Friday and provides some optimism for possible continuation into next week. But there is still a lot of rebuilding to do across both indexes. Many leading stocks will face overhead supply resistance as they move back toward new highs.
While the two lagging indexes attempt to rally back to new highs, expect investors to stay hyper-focused on inflation and any responses from the Fed. Changes in monetary policy will be met with a swift reaction.
The Nasdaq declined -1.51% for the week, ending the week in the middle of the range with a 52% closing range. Volume was lower than the previous week, with much of the volume focused on Tuesday's sell-off and Thursday's mid-day bounce.
The Dow Jones Industrial average (DJI) didn't have a single declining day during the week and advanced +2.67% over the five days. The S&P 500 (SPX) gained +1.23% for the week. The Russell 2000 (RUT) gained +0.23% after taking a round trip below its 21d EMA and 50d MA but closing just above where it opened for the week.
The VIX volatility index declined -10.32% for the week.
It was the cyclical sectors that ruled the week. Energy ( XLE ), Materials ( XLB ), Financials ( XLF ) and Industrials ( XLI ) were the top four sectors of the week.
The cyclical sectors are benefiting from a pick-up in economic activity driving demand for products from building materials, infrastructure and the manufacturing of consumables. Supply has not been able to keep up with the increased demand, driving commodity prices higher. Timber, Copper , Aluminum are all skyrocketing. And demand for oil is increasing as transportation picks back up.
While the Dow Jones Industrial average (DJI) and S&P 500 (SPX) hit new all-time records, there were four sectors that lost for the week. Technology ( XLK ) and Consumer Discretionary ( XLY ) fell on Monday thru Wednesday along with the Nasdaq, as investors rotated to re-opening and infrastructure stocks.
Real Estate ( XLRE ) and Utilities ( XLU ) were the bottom two sectors. Investors did not have interest in the defensive equity plays this week. Investors remain confident in the equities market, but are playing toward value, re-opening and infrastructure.
The US Treasury 30y, 10y and 2y yields all declined for the week, continuing to flatten the yield curve since its sharpest point in March.
Both the High Yield Corporate Bond (HYG) prices declined slightly while Investment Grade Bond (LQD) prices advanced.
The US Dollar (DXY) declined -1.17% for the week, resting just above a support area from 2018.
Commodities, especially the resources required for recovery, continue to reach new historic high prices.
Silver (SILVER) and Gold (GOLD) advanced +5.94% and +3.53% for the week.
Crude Oil (CRUDEOIL1!) advanced +0.85%.
Timber (WOOD) advanced +5.43%.
Copper (COPPER1!) advanced +4.40% and Aluminum (ALI1!) advanced +5.90%, putting in the fifth week in a row of gains.
This growth/value comparison we've been tracking is showing the big rotation back into value over the past week.
-=x=-=x=-=x=-=x=-=x=-=x=-=x=-
The Big Four Mega-caps
The big four mega-caps were looking a little ugly on the daily charts this past two weeks. But it's always important to take a broader look at the weekly, and although not great, it doesn't look so bad either. Apple (AAPL), Microsoft (MSFT) and Amazon (AMZN) all touched their 10e moving average lines, found support and closed above them. Microsoft was even able to get a slight gain for the week, advancing +0.11%. Apple (AAPL) was down -0.95%. Amazon (AMZN) had the biggest loss of -5.07%, but still stayed above the key moving average line. Alphabet (GOGL) had a dip but recovered, closing just -0.07% from where it opened the week.
-=x=-=x=-=x=-=x=-=x=-=x=-=x=-
The Four Recovery Stocks
I picked four recovery stocks to track against the indexes and other indicators in this weekly report. Exxon Mobile (XOM) had a huge gain this week, advancing +9.07%. However, my other recovery stocks are all down. Delta Airlines (DAL) lost -1.74%. Marriott (MAR) declined -1.23%. Carnival Cruise Lines (CCL) lost -4.29%. So the focus on re-opening stocks may be more about the infrastructure plays and manufacturing goods required to meet increasing consumer demands.
-=x=-=x=-=x=-=x=-=x=-=x=-=x=-
Investor Sentiment
The put/call ratio (PCCE) closed the week at 0.650, a little lower from the previous week, but was up and down throughout the week. A contrarian indicator, when the put/call ratio is below 0.7, it signals overly bullish sentiment and could mean an overbought market.
The CNN Fear & Greed index is on the greed side but not far off neutral.
The NAAIM money manager exposure index declined to 87.79, after topping 100 last week.
-=x=-=x=-=x=-=x=-=x=-=x=-=x=-
The Week Ahead
There are still a high number of earnings reports, so keep an eye on your portfolio so you are not surprised.
Monday
There is not much significant economic news scheduled for Monday.
JD.com (JD), Marriott (MAR), Roblox (RBLX), Trade Desk (TTD), Trex (TREX), Magnite (MGNI) and VUZIX (VUZI) are a few of the interesting earnings reports for Monday.
Tuesday
On Tuesday, we will get the Monthly OPEC Report and the EIA Shot-Term Energy Outlook. The JOLTS Job Openings report for March will be released just after market open. FOMC Members are scheduled to speak throughout the day. There's also a 3y note-auction which is not quite as important as the 10y, but may be viewed as a preview for the longer term auction performance.
Earnings releases will include Electronic Arts (EA), Palantir (PLTR), Unity Software (U), Quantumscape (QS), Plug Power (PLUG), Upstart (UPST), Lemonade (LMND), Open Lending (LPRO), Selectquote (SLQT),
Wednesday
Consumer Price Index data for April will be released on Wednesday. An indicator of inflation, the numbers will be watched closely. Crude Oil Inventories will be updated in the morning after market open. The 10y treasure note auction will be in the afternoon.
Toyota Motor (TM) along with a large number of Japanese company earnings reports will be released on Wednesday. Some other interesting reports will include Dynatrace (DT) and Bumble (BMBL).
Thursday
The weekly update on Jobless Claims comes on Thursday. Also Produce Price Index data will be released in the morning.
Earnings Reports include Alibaba (BABA), Walt Disney (DIS), AirBnB (ABNB), Coinbase (COIN), DoorDash (DASH), Farfetch (FTCH), Celsius (CELH), and DermTech (DMTK).
Friday
Friday brings an update to Core Retail Sales for April. Export/Import Price Index data will also be released. Closer to open, the Industrial Production and Business Inventories data will be released. Consumer Expectations and Consumer Sentiment numbers for May will come after the market open.
Another large round of Japanese earnings reports come on Friday. UP fintech (TIGR) is also schedule to report on Friday.
-=x=-=x=-=x=-=x=-=x=-=x=-=x=-
The Bullish Side
Although there is caution in the market at all-time highs for two of the major indexes, there is a switch from previous weeks where Utilities and Real Estate were leading sectors, back to less cautious sectors. And although investors are still playing the value trade against the growth trade, we saw a growth and tech to start to play in the rally on Thursday as well.
It's also very possible based on data available from banks, that hedge funds have been short selling the growth play which has forced prices even lower. The data says the increasing amount of shorts are coming via ETFs, which in light of the GameStop frenzy, seems to be the safer way to play the short side for now. But if the Nasdaq and the passive indexes start to rally, the hedgefunds will need to cover shorts nonetheless, possibly unlocking a short squeeze at a broader level.
As the long as the fed keeps monetary policy, the market will continue to be propped up and any short-sell plays will eventually hit their limit and the buying has to begin again. Let's see.
-=x=-=x=-=x=-=x=-=x=-=x=-=x=-
The Bearish Side
We've just had several weeks of first quarter earnings reports that beat the previous year, but shared lower guidance for the coming quarters. Many of those companies were driving the market to historical gains over the past year. Now that Q2 has arrived, the year-over-year comparable earnings will get much tougher. That's going to mean more downside for companies that are driving the high prices in the market.
Still, as the economic recovery picks up more steam, investors worry over inflation and interest rates will increase as well. Any small statement like we saw from Yellen this past week could send investors for the exits. And if we actually see a response from the Fed that would touch monetary policy, it will certainly mean a taper tantrum if not done carefully.
-=x=-=x=-=x=-=x=-=x=-=x=-=x=-
Key Nasdaq Levels to Watch
The Nasdaq found itself below the 21d EMA again this week, but found support at the bottom of the channel from the March 2020 lows. That channel remains intact and the index closed above the 50d MA despite the dip.
On the positive side, the levels are:
The 21d EMA is at 13,797.33 and is a key level for the index to rise above.
The 10d MA is at 13,882.14.
14,000 has been a key area of support/resistance. The index has only stayed above this level for a few days at a time since the beginning of 2021.
This past weeks high is 14,042.12.
The all-time high is at 14,211.57 is the all-time high and the high of this week.
14,923 is the middle line of the channel from the March 2020 bottom. The index has been in the channel, but below the midline for the past ten weeks.
On the downside, there are a few key levels:
A previous support area is around 13,600.
The lower line of the channel from the March 2020 bottom is around 13,563 for next week.
The 50d MA is is at 13,529.61 and is an important line to stay above.
The low of this past week is 13,439.39. Let's get a higher low for next week.
-=x=-=x=-=x=-=x=-=x=-=x=-=x=-
Wrap-up
If you are a growth investor, it was probably a pretty tough week for your portfolio. Investors were focused on the value play and there was a ton of selling pressure for growth early in the week. But as the Dow Jones Industrial average and S&P 500 close the week at all-time highs, it could be just the right time to take profits and rotate them back into growth stocks.
Good luck, stay healthy and trade safe!

Nasdaq Got rejected after reching new highs on a bullish earnings season the Nasdaq pulled back to its original trendline set in place after 2020 crash. Bullish pattern now showing. Even so , economic factors could change the trajectory such as Interest rates, inflation , 10 year yields can't be ignore. Also RSI still showing divergence, I'm thinking a breakout on RSI would coincide with a breakout in a ascending triangle pattern. A trip to 14,200 and rejection in the next week would give me more conformation on this pattern

Daily Market Update for 5/7Summary: More records were set as the S&P 500 and Dow Jones Industrial average both had record closes while the Nasdaq and Russell 2000 joined the rally, also making gains. Employment data in the morning caused the dollar to fall which can give a boost to mega-caps and growth stocks.
Notes
Ideas always welcome in the comments. Errors will be amended as comments on TradingView or corrected inline in my blog.
-=x=-=x=-=x=-=x=-=x=-=x=-=x=-
Friday, May 7, 2021
Facts: +0.88%, Volume lower, Closing range: 60% (w/gap), Body: 21%
Good: Higher close, higher high, higher low, confirmation of yesterday's hammer
Bad: Lower volume, gap-up may need revisiting
Highs/Lows: Higher high, higher low
Candle: Longer upper wick over a thin green body in lower half of candle, gap-up at open
Advance/Decline: About three gaining stocks for every declining stock
Indexes: SPX (+0.74%), DJI (+0.66%), RUT (+1.35%), VIX (-9.24%)
Sectors: Energy (XLE +1.78%) and Real Estate (XLRE +1.22%) were top. Utilities (XLU +0.30%) and Consumer Staples (+0.00%) were bottom.
Expectation: Sideways or Higher
-=x=-=x=-=x=-=x=-=x=-=x=-=x=-
Market Overview
More records were set as the S&P 500 and Dow Jones Industrial average both had record closes while the Nasdaq and Russell 2000 joined the rally, also making gains. Employment data in the morning caused the dollar to fall which can give a boost to mega-caps and growth stocks.
The Nasdaq closed with a +0.88% gain. Volume was lower and the morning rally faded through the day, giving the candle a 60% closing range (including the gap) and a thin 21% body under a long upper wick. Nonetheless, the positive gain with a higher high and higher low is a confirmation of the previous day's reversal hammer candle. There were three gaining stocks for every declining stock.
The S&P 500 (SPX) gained +0.75%, while the Dow Jones Industrial average (DJI) advanced +0.66%, both having record closes. The Russell 200 (RUT) gained +1.35% and closed with a 99% closing range.
The VIX volatility index declined -9.24%.
Energy (XLE +1.78%) and Real Estate (XLRE +1.22%) were top. Utilities (XLU +0.30%) and Consumer Staples (+0.00%) were bottom. No sectors declined for the day.
-=x=-=x=-=x=-=x=-=x=-=x=-=x=-
Economic Indicators
The US Dollar (DXY) declined -0.73% after non-farm employment data was lower than expected.
The US 30y, 10y advanced while the 2y yield declined, widening the spread between long and short term treasury notes.
High Yield Corporate Bond (HYG) prices and Investment Grade Corporate Bond (LQD) prices advanced.
Silver (SILVER) and Gold (GOLD) both advanced. Crude Oil (CRUDEOIL1!) declined. Timber (WOOD) advanced. Copper (COPPER1!) and Aluminum (ALI1!) advanced. A continuing trend in the commodities resulting from the economic recovery.
-=x=-=x=-=x=-=x=-=x=-=x=-=x=-
Investor Sentiment
The put/call ratio declined to 0.650. The put/call ratio (PCCE) is a contrarian indicator that shows overly bullish or overly bearish investor behavior. The 0.7 level is considered normal. As it approaches 0.60 (overly bullish) and below, watch for a possible pullback in the market.
The CNN Fear & Greed index moved a bit more toward the greed side.
The NAAIM money manager exposure index declined to 87.79, after topping 100 last week.
-=x=-=x=-=x=-=x=-=x=-=x=-=x=-
Market Leaders
Of the biggest mega-caps, only Amazon (AMZN) declined with a -0.45% loss, closing underneath its 21d EMA. Apple (AAPL) advanced +0.36% but could not quite close above the 21d EMA. Microsoft (MSFT) gapped-up at open and closed with a +1.09% gain, moving above its 21d EMA. Alphabet (GOOGL) has been trading above the 21d EMA and continued its rally with a +0.62% gain today.
Nike (NKE), ASML Holding (ASML), Nvidia (NVDA) and Comcast (CMCSA) topped the mega-caps list. At the bottom of the list were Verizon Communications (VZ), AT&T (T), Salesforce.com (CRM), and Walmart (WMT).
Roku (ROKU) please investors with earnings, sending it to the top of the growth stock list with a 11.55% gain for the day. DataDog (DDOG), Digital Turbine (APPS) and Grow Generation (GRWG) were also near the top of the list with greater than 5% gains.
-=x=-=x=-=x=-=x=-=x=-=x=-=x=-
Looking ahead
There is not much significant economic news scheduled for Monday.
JD.com (JD), Marriott (MAR), Roblox (RBLX), Trade Desk (TTD), Trex (TREX), Magnite (MGNI) are a few of the interesting earnings reports for Monday.
-=x=-=x=-=x=-=x=-=x=-=x=-=x=-
Trends, Support and Resistance
The Nasdaq rallied above the 21d EMA briefly before fading and closing below the line, but above the 13,600-13,700 support area.
The trend line from the 3/5 low points to a +3.51% advance.
The one-day trend line points to a -0.03% loss.
The five-day trend line points to a -2.19% decline.
-=x=-=x=-=x=-=x=-=x=-=x=-=x=-
Wrap-up
Nonfarm employment data that was lower than expected today, sent the US Dollar tumbling. That was a good thing for large mega-caps and growth companies that benefit from a weaker dollar. But it alsos cause indexes to rise, including passive indexed instruments such as ETFs.
There is data that shows a large number of short selling of ETFs from hedgefunds in the past month. No doubt, you probably have some stocks that seemed to never get support and they were likely impacted by the short selling. But when the big indexes start to move, those shorts need to be covered and it can cause the broader rally we saw today.
I've marked an expectation for sideways on Monday, but let's hope for a continued squeeze that could take the major indexes another leg higher. Have a good weekend!
Stay healthy and trade safe!

Daily Market Update for 5/6Summary: Another record was set for the Dow Jones Industrial average while value stocks continue to outpace growth stocks. Two intraday rallies might just be the action the Nasdaq needed to join the rally, but the gains were mostly isolated to the mega-caps.
Notes
Ideas always welcome in the comments. Errors will be amended as comments on TradingView or corrected inline in my blog.
-=x=-=x=-=x=-=x=-=x=-=x=-=x=-
Thursday, May 6, 2021
Facts: +0.37%, Volume higher, Closing range: 99%, Body: 38%
Good: High closing range with gain on higher volume
Bad: Lower low with dip below 50d moving average
Highs/Lows: Lower high, lower low
Candle: Hammer with long lower wick and smaller body in upper half of candle
Advance/Decline: Almost three declining stocks for every advancing stock
Indexes: SPX (+0.82%), DJI (+0.93%), RUT (+0.00%), VIX (-3.97%)
Sectors: Financials (XLF +1.49%) and Consumer Staples (XLP +1.29%) were top. Consumer Discretionary (XLY -0.22%) and Health (XLV -0.13%) were bottom.
Expectation: Sideways or Higher
-=x=-=x=-=x=-=x=-=x=-=x=-=x=-
Market Overview
Another record was set for the Dow Jones Industrial average while value stocks continue to outpace growth stocks. Two intraday rallies might just be the action the Nasdaq needed to join the rally, but the gains were mostly isolated to the mega-caps.
The Nasdaq closed with a +0.37% gain on higher volume. The mid-day rallies formed a long lower wick with a smaller 38% green body in the upper half of the candle, forming a hammer. A hammer can signal a trend reversal but needs to be confirmed the following day. The closing range of 99% comes after a rally late in the afternoon.
The Dow Jones Industrial average (DJI) had another record close, gaining +0.93% for the day. The S&P 500 (SPX) climbed +0.82%. The Russell 2000 (RUT) closed just about where it opened for no gain or loss.
The VIX volatility index declined -3.97%.
Financials (XLF +1.49%) and Consumer Staples (XLP +1.29%) topped the sector list. All sectors ended the day with gains. Consumer Discretionary (XLY -0.22%) and Health (XLV -0.13%) were the worst performers.
-=x=-=x=-=x=-=x=-=x=-=x=-=x=-
Economic Indicators
The US Dollar (DXY) stayed about the same with a -0.40% decline.
The US 30y, 10y declined while the 2y yields rose.
High Yield Corporate Bond (HYG) prices declined. Investment Grade Corporate Bond (LQD) prices advanced.
Silver (SILVER) declined and Gold (GOLD) advanced. Crude Oil (CRUDEOIL1!) declined. Timber (WOOD) advanced. Copper (COPPER1!) and Aluminum (ALI1!) advanced.
-=x=-=x=-=x=-=x=-=x=-=x=-=x=-
Investor Sentiment
The put/call ratio declined to 0.722. The put/call ratio (PCCE) is a contrarian indicator that shows overly bullish or overly bearish investor behavior. The 0.7 level is considered normal. As it approaches 0.60 (overly bullish) and below, watch for a possible pullback in the market.
The CNN Fear & Greed index remains near neutral.
-=x=-=x=-=x=-=x=-=x=-=x=-=x=-
Market Leaders
All four biggest mega-caps reversed intraday losses to end the day with gains. Apple (AAPL) advanced +1.28%. Microsoft (MSFT) had a +1.32% gain. Amazon (AMZN) gained +1.10%. Alphabet (GOOGL) gained +0.98%. Apple and Microsoft reversals came after tests of their 50 moving average. Alphabet (GOOGL) came close to the 21d EMA before moving higher.
Cisco (CSCO), Berkshire Hathaway (BRK), JP Morgan (JPM) and PayPal (PYPL) were the top mega-caps for today. The majority of mega-caps ended the day with gains. Pfizer (PFE) and Tesla (TSLA) were at the bottom of the list with more than 1% declines.
There were a few winners in the daily update growth stock list. Zynga (ZNGA) gained +5.62% after giving surprise guidance in their earnings call. Ehang Holdings (EH), PayPal (PYPL) and Facebook (FB) were other growth stocks at the top of the list. Fastly (FSLY) declined -27.13%, disappointing investors with their earnings release. Etsy (ETSY) also dropped after an earnings disappointment, declining -14.57%. CloudFlare (NET) declined -12.59%, but gained 8% after hours with an earnings report that exceeded expectations.
-=x=-=x=-=x=-=x=-=x=-=x=-=x=-
Looking ahead
More labor statistics will be released on Friday with the Average Hourly Earnings data, Nonfarm Payrolls, Labor Participation data and the Unemployment rate all released before market open.
Adidas (ADDYY), BMW (BMWYY), DraftKings (DKNG), Cinemark (CNK) are a few of the companies to report on Friday and end a big earnings week.
-=x=-=x=-=x=-=x=-=x=-=x=-=x=-
Trends, Support and Resistance
The index dipped below the 50d moving average, but closed above the line. It also touched the lower boundary of a channel drawn from March 2020.
The trend line from the 3/5 low points to a +4.22% advance which does not seem possible unless investor sentiment changed dramatically.
The one-day trend line points to a -0.63% loss.
The five-day trend line points to a -0.76% decline.
-=x=-=x=-=x=-=x=-=x=-=x=-=x=-
Wrap-up
Initial jobless claims data was much lower than expected, helping drive the rally in the Dow Jones today. But the Nasdaq dipped below the 50d moving average twice before finally rallying into close.
Investors continued to react to the guidance in earnings reports much more closely than meeting current quarter expectations.
Based on the hammer candlestick today, I'll look for sideways or higher tomorrow as an expectation. If so, that would be a nice confirmation of the reversal represented by today's candle. If not, then I'll continue to feel the pain while value stocks feel the gain.
Stay healthy and trade safe!

Daily Market Update for 5/5Summary: This is not the rally we are looking for. The Dow Jones Industrial average closed at a record high today while the rest of the market struggled to hold any gains, with the Nasdaq and Russell 2000 falling further behind the other major indexes.
Notes
Ideas always welcome in the comments. Errors will be amended as comments on TradingView or corrected inline in my blog.
-=x=-=x=-=x=-=x=-=x=-=x=-=x=-
Wednesday, May 5, 2021
Facts: -0.39%, Volume lower, Closing range: 13%, Body: 76%
Good: Lower than average volume
Bad: Lower high, thick red body from afternoon decline
Highs/Lows: Lower high, higher low
Candle: Inside day, thick red body with similar small upper and lower wicks
Advance/Decline: Two declining stocks for every advancing stock
Indexes: SPX (-0.37%), DJI (+0.29%), RUT (-0.31%), VIX (-1.69%)
Sectors: Energy (XLE +3.23%) and Materials (XLB +1.27%) were top. Real Estate (XLRE -1.47%) and Utilities (XLU -1.69%) were bottom.
Expectation: Sideways or Lower
-=x=-=x=-=x=-=x=-=x=-=x=-=x=-
Market Overview
This is not the rally we are looking for. The Dow Jones Industrial average closed at a record high today while the rest of the market struggled to hold any gains, with the Nasdaq and Russell 2000 falling further behind the other major indexes.
The Nasdaq closed with a -0.39% loss for the day on lower than average volume. The 13% closing range is under a 76% body with a short lower wick created from a late afternoon dip. The short upper wick was formed just after open before the bears took over. There were two declining stocks for every advancing stock.
The Dow Jones Industrial average (DJI) gained +0.29% for the day. The S&P 500 (SPX) was nearly flat at a +0.07% advance. The Russell 2000 (RUT) declined -0.31%.
The VIX volatility index declined -1.69%.
Cyclicals are still the focus for the market, the only gaining sectors for the day. Energy (XLE +3.23%) and Materials (XLB +1.27%) were top. Crude Oil Inventories were much lower than expected, signaling higher demand. Real Estate (XLRE -1.47%) and Utilities (XLU -1.69%) were at the bottom. It doesn't seem investors are fleeing to safe bets like utilities, but they are going aggressively after cyclical stocks and not broadly making bets across all sectors.
-=x=-=x=-=x=-=x=-=x=-=x=-=x=-
Economic Indicators
The US Dollar (DXY) stayed about the same with a -0.02% decline.
The US 30y, 10y and 2y yields all declined with the yield curve flattening some more.
High Yield Corporate Bond (HYG) prices and Investment Grade Corporate Bond (LQD) prices advanced.
Silver (SILVER) declined and Gold (GOLD) advanced. Crude Oil (CRUDEOIL1!) advanced. Timber (WOOD) advanced. Copper (COPPER1!) declined while Aluminum (ALI1!) advanced.
-=x=-=x=-=x=-=x=-=x=-=x=-=x=-
Investor Sentiment
The put/call ratio declined to 0.655. The put/call ratio (PCCE) is a contrarian indicator that shows overly bullish or overly bearish investor behavior. The 0.7 level is considered normal. As it approaches 0.60 (overly bullish) and below, watch for a possible pullback in the market.
The CNN Fear & Greed index remains near neutral.
-=x=-=x=-=x=-=x=-=x=-=x=-=x=-
Market Leaders
Apple (AAPL) and Alphabet (GOOGL) gained for the day with +0.20% and +0.35% advances. Microsoft declined -0.53%. Amazon (AMZN) declined -1.25%.
Exxon Mobil (XOM) and Chevron (CVX) led the mega-caps with ~3% gains. ASML Holding (ASML) and AbbVie (ABBV) round out the top four. Mastercard (MA), Walt Disney (DIS), Netflix (NFLX) and Amazon (AMZN) were the bottom four mega-caps.
Growth stocks continue to struggle in the current market. Penn National Gaming (PENN), FUTU Holdings (FUTU), Nvidia (NVDA) and Solar Edge (SEDG) were at the top of a short list of growth stock gains for the day. Peloton (PTON) fell more than 14% on news of a recall on their Treadmills. Moderna (MRNA) fell -6.19% as the US decided to support lifting patent protections for COVID vaccines. Ehang Holdings (EH) and Roku (ROKU) were also at the bottom of the growth stock list.
-=x=-=x=-=x=-=x=-=x=-=x=-=x=-
Looking ahead
The weekly Initial Jobless Claims numbers will be released on Thursday morning as well as Nonfarm Productivity and Unit Labor Costs.
Thursday will be another busy day of earnings reports. Linde (LIN), Anheuser Busch (BUD), Volkswagen (BWAPY), Square (SQ), Fidelity (FIS), Moderna (MRNA), Roku (ROKU), Expedia (EXPE), Beyond Meat (BYND), AMC Entertainment (AMC) are some of the interesting reports.
The earnings list is long, so check your portfolio for earnings events so you are not surprised.
-=x=-=x=-=x=-=x=-=x=-=x=-=x=-
Trends, Support and Resistance
The index moved back below the 13,600 - 13,700 area, but remains above the 50d moving average.
The trend line from the 3/5 low points to a +4.22% advance which does not seem possible unless investor sentiment changed dramatically.
The one-day trend line points to a -0.63% loss.
The five-day trend line points to a -0.76% decline.
If we break below the 50d MA, we'll start a new trend line from the 4/29 all-time high.
-=x=-=x=-=x=-=x=-=x=-=x=-=x=-
Wrap-up
The story of earnings reactions continues this week. If you want to know what investors care about, it's pretty obvious they are looking beyond results and want to see guidance for the remainder of the year.
That's the challenge for companies like Twilio and Etsy who beat earnings estimates this quarter but are offering lower guidance for the remainder of the year compared to the massive performance they had during the height of the pandemic. Both were down in afterhours trading.
On the other hand, Zynga (ZNGA) missed estimates but offered upbeat guidance and rose more than 5% in after hours. The mortal sin however was to miss estimates and also not provide a positive outlook. Fastly (FSLY) did just that and dropped -17.5% after hours. Ouch!
Stay healthy and trade safe!

Daily Market Update for 5/4Summary: The market sold off sharply at open after comments from Janet Yellen suggested that interest rates might need to increase to keep the economy from overheating. Investors fled sectors more sensitive to interest rate hikes and rotated into the cyclical sectors.
Notes
Ideas always welcome in the comments. Errors will be amended as comments on TradingView or corrected inline in my blog.
-=x=-=x=-=x=-=x=-=x=-=x=-=x=-
Monday, May 4, 2021
Facts: -1.88%, Volume higher, Closing range: 37% (w/gap), Body: 45%
Good: Bounced off 50d moving average line
Bad: Gap down on news, high volume distribution
Highs/Lows: Lower high, lower low
Candle: Thick red body in upper half of candle, long lower wick
Advance/Decline: Almost four declining stocks for every advancing stock
Indexes: SPX (-0.67%), DJI (+0.06%), RUT (-1.28%), VIX (+6.39%)
Sectors: Materials (+1.09%) and Financials (XLF +0.80%) were top. Consumer Discretionary (XLY -1.04%) and Technology (XLK -1.79%) were bottom.
Expectation: Sideways or Lower
-=x=-=x=-=x=-=x=-=x=-=x=-=x=-
Market Overview
The market sold off sharply at open after comments from Janet Yellen suggested that interest rates might need to increase to keep the economy from overheating. Investors fled sectors more sensitive to interest rate hikes and rotated into the cyclical sectors.
The Nasdaq opened with a gap-down and closed the day with a -1.88% decline on much higher volume. The index continued to decline after open until it hit the 50d moving average and found support through the afternoon. The result is a long lower wick underneath a 45% red body and a 37% closing range, considering the gap as part of the range. There were nearly four declining stocks for every advancing stock.
Only the Dow Jones Industrial average (DJI) was able to recover from the morning sell-off and gain +0.06% for the day. The S&P 500 (SPX) dipped just below its 21d EMA before climbing back to end the day with a -0.67% decline. The Russell 2000 (RUT) declined -1.28%.
The VIX volatility index advanced +6.39% but was up 20% intraday.
The cyclical sectors benefited from the volatile day, with Materials (+1.09%) and Financials (XLF +0.80%) at the top of the list. Consumer Discretionary (XLY -1.04%) and Technology (XLK -1.79%) were bottom, sectors that are exposed to higher interest rates.
-=x=-=x=-=x=-=x=-=x=-=x=-=x=-
Economic Indicators
The US Dollar (DXY) advanced +0.35%.
The US 30y treasury bond yield and 10y note yield both declined. The 2y note yield rose.
High Yield Corporate Bond (HYG) prices declined while the Investment Grade Corporate Bond (LQD) prices advanced.
Silver (SILVER) and Gold (GOLD) declined. Crude Oil (CRUDEOIL1!) advanced. Timber (WOOD) advanced. Copper (COPPER1!) declined while Aluminum (ALI1!) advanced.
-=x=-=x=-=x=-=x=-=x=-=x=-=x=-
Investor Sentiment
The put/call ratio rose to 0.741. The put/call ratio (PCCE) is a contrarian indicator that shows overly bullish or overly bearish investor behavior. The 0.7 level is considered normal. As it approaches 0.60 (overly bullish) and below, watch for a possible pullback in the market.
The CNN Fear & Greed index remains near neutral.
-=x=-=x=-=x=-=x=-=x=-=x=-=x=-
Market Leaders
The big four mega-caps all had big declines. Apple (AAPL) declined -3.54%, finding support at its 50d moving average. Microsoft lost -1.62%. Amazon (AMZN) dropped below its 21d EMA with a -2.20% decline. Alphabet (GOOGL) is the only of the four to remain above the key moving average lines with a -1.55% loss today.
AT&T (T), Oracle (ORCL), Johnson & Johnson (JNJ) and JP Morgan Chase (JPM) were the top mega-caps for the day. ASML Holdings (ASML), Apple (AAPL), PayPal (PYPL) and Nvidia (NVDA) were at the bottom of the list.
Only a few of the growth stocks in the daily update list had gains. Peloton (PTON) and DR Horton (DHI) advanced under 1%. At the bottom of the list was Solar Edge (SEDG) with a 15.95% decline, disappointing investors with its earnings report. Moderna (MRNA), Enphase (ENPH) and SNAP (SNAP) also found themselves at the bottom of the list.
-=x=-=x=-=x=-=x=-=x=-=x=-=x=-
Looking ahead
ADP Nonfarm Employment data will be released on Wednesday morning. In addition, the purchasing manager indexes for Services and Non-Manufacturing sectors will be released after the market opens. Crude Oil Inventories will be updated in the morning as well.
PayPal (PYPL), Uber (UBER), Boking (BKNG), General Motors (GM), MercadoLibre (MELI), Twilio (TWLO), Rocket (RKT), Hilton (HLT), Etsy (ETSY), HubSpot (HUBS), 10x Genomics (TXG), Qorvo (QRVO), Zynga (ZNGA), Fastly (FSLY), Redfin (RDFN), Palomar (PLMR) is an abbreviated list of a massive number of earnings reports for Wednesday.
The earnings list is long, so check your portfolio for earnings events so you are not surprised.
-=x=-=x=-=x=-=x=-=x=-=x=-=x=-
Trends, Support and Resistance
The index found support at its 50d moving average line today and moved back into the 13,600 - 13,700 area.
The trend line from the 3/5 low points to a +3.84% advance which would require a substantial confidence booster for investors to get that in one day. Nonetheless, it is the mid-point of that longer regression trend channel.
The five-day trend line points to a -0.69% decline.
The one-day trend line points to a -0.94% loss.
If we break below the 50d MA, we'll start a new trend line from the 4/29 all-time high.
-=x=-=x=-=x=-=x=-=x=-=x=-=x=-
Wrap-up
We've known how sensitive investors are to inflation and interest rate news. It showed up in last week's cold reception to any positive news, whether positive earnings or good economic numbers. And so it just took a few words from Treasury Secretary Janet Yellen to send investors into a frenzy this morning. Later in the day, she is walking back the comments but the damage to investor confidence is done.
The good news is that in today's after hours market, reactions to positive earnings reports seems to be good. Lyft (LYFT) was trading up 6.10% after an earnings surprise. Zillow (Z) was up almost 5% with its earnings beat. Skillz (SKLZ) was down slightly after volatile aftermarket session as investors reacted to its earnings beat and improved guidance.
Expecting sideways or lower for tomorrow with a hope for a positive expectation breaker.
Stay healthy and trade safe!

Are we just going to pretend this fractal doesn't exist. I haven't posted in a while because it is pointless. My English is bad but still I decided to post this. It's about to get real. 2000 Dot com bubble Weekly chart looks eerily similar to the our current position on the monthly chart. Nature likes making repeating shapes. I won't get into it, look it up. The writing is all over the wall right now. From the charts, to the news, to what I am seeing in my daily life.
I live in an affluent area and for the past year or two I have been seeing these gambling places open up on strip malls. They are usually called May's or Stella's or Terra's or something like that. Those places are always empty when I walk by but they keep popping up. Big money is really doubling down on the idea that gambling parlors in affluent areas will be good business one day. Makes me think tough times ahead. Noticing lots of celebs get involved in alcohol sales. A business that thrives during bad times. Do they know something
Ultra Speculative asset are mooning just because. CumRocket is about to be the next Mexican Peso or whatever the fck they are saying on twitter. Rare art prices are mooning. Wood prices mooning. Rolex prices mooning. Bubble after bubble after bubble.
US dollar index monthly chart rejected from the downtrend line and then double topped near the line. Lower low coming from the dollar. Gold is up and poised to go higher, silver and platinum are set to move. Aluminum, lead, nickel, steel all ready to move up in a big way.
I know this sounds crazy as I usually do but something stuck out at me when the Meme stock drama unfolded. Firstly about that I have been following all those stocks and in my opinion they are ready to move HARD. Yea maybe $1000 a share for GME just because. anyways, what stuck out at me was how the media was really trying to brand what was happening as all Wallstreet bets and Reddit. No matter what random stock went up off technical bounce likely spurred mostly buy big algo buying it was all because of reddit. I don't know why but I think they are setting up to make retail the scapegoat of what will come. Meme stocks were often pumping on days the overall market was blood red and many talking heads went out of their way to repeat that narrative as their overlords commanded that people were selling real stocks for these joke stocks. Some also went as far as saying retail shouldn't be allowed to trade directly. Nobody is going to tell me that Reddit was responsible for GME AND NOK AND BB AND AAL AND BBW AND KOSS AND AMC AND everything else. How much f'ing money do they think reddit has, they think we are idiots. Even with the leverage they would need tens of billions of dollars. Something def doesn't smell right.
Soon we will see what they mean by The Great Reset.

Daily Market Update for 5/3Summary: The cyclical sectors soared. The others did not. A rotation into reopening and cyclical stocks played well for all the major indexes except the Nasdaq which is heavy in big-tech and growth stocks.
Notes
Ideas always welcome in the comments. Errors will be amended as comments on TradingView or corrected inline in my blog.
-=x=-=x=-=x=-=x=-=x=-=x=-=x=-
Monday, May 3, 2021
Facts: -0.48%, Volume lower, Closing range: 8%, Body: 85%
Good: Held above the 21d EMA
Bad: Lower high, lower low, could not stay above 14,000
Highs/Lows: Lower high, lower low
Candle: Thick red body with small upper and lower wicks
Advance/Decline: Slightly more declining stocks than advancing stocks
Indexes: SPX (+0.27%), DJI (+0.70%), RUT (+0.49%%), VIX (-1.61%)
Sectors: Energy (XLE +2.75%) and Materials (XLB +1.49%) were top sectors. Communications (XLC -0.53%) and Real Estate (XLRE -0.54%) were bottom.
Expectation: Sideways or Lower
-=x=-=x=-=x=-=x=-=x=-=x=-=x=-
Market Overview
The cyclical sectors soared. The others did not. A rotation into reopening and cyclical stocks played well for all the major indexes except the Nasdaq which is heavy in big-tech and growth stocks.
The Nasdaq closed down -0.48% on lower volume. A brief rally attempt in the morning brought the index above 14,000 before selling off and testing the 21d EMA several times before closing just above the intraday lows. The thick red body covers 85% of the candle is surrounded by a short upper and lower wick with a closing range of 8%. There were slightly more declining stocks than advancing stocks.
The Dow Jones Industrial average (DJI) was the best performing index of the day, gaining +0.70%. The S&P 500 (SPX) gained +0.27% and had another record close. The Russell 2000 (RUT) advanced +0.49%.
The VIX volatility index declined -1.61%.
Energy (XLE +2.75%) and Materials (XLB +1.49%) were the top sectors. All cyclical sectors gained for the day. Communications (XLC -0.53%) and Real Estate (XLRE -0.54%) were at the bottom.
-=x=-=x=-=x=-=x=-=x=-=x=-=x=-
Economic Indicators
The US Dollar (DXY) declined -0.37%.
The US 30y treasury bond and 10y and 2y note yields all declined.
High Yield Corporate Bond (HYG) prices declined while the Investment Grade Corporate Bond (LQD) prices advanced.
Silver (SILVER) and Gold (GOLD) advanced. Crude Oil (CRUDEOIL1!) advanced. Timber (WOOD) advanced. Copper (COPPER1!) advanced while Aluminum (ALI1!) remained flat.
-=x=-=x=-=x=-=x=-=x=-=x=-=x=-
Investor Sentiment
The put/call ratio dropped to 0.577. The put/call ratio (PCCE) is a contrarian indicator that shows overly bullish or overly bearish investor behavior. The 0.7 level is considered normal. As it approaches 0.60 (overly bullish) and below, watch for a possible pullback in the market.
The CNN Fear & Greed index moved back toward neutral.
-=x=-=x=-=x=-=x=-=x=-=x=-=x=-
Market Leaders
Apple (AAPL) was the only gainer of the biggest four mega-caps with a +0.82% advance. Microsoft (MSFT) declined -0.13% after attempting to rise above the 21d EMA but failing. Amazon (AMZN) was down -2.33%, closing just above the 21d EMA. Alphabet (GOOGL) declined -0.44%.
Pfizer (PFE), Exxon Mobil (XOM), Home Depot (HD) and Oracle (ORCL) were the top mega-caps for the day. PayPal (PYPL), Amazon (AMZN), Salesforce.com (CRM) and Tesla (TSLA) were at the bottom of the list.
It was another disappointing day for growth stocks, but there were some winners. Moderna (MRNA), DR Horton (DHI), RH (RH), and Penn National Gaming (PENN) topped the list. UP Fintech (TIGR), DataDog (DDOG), Digital Turbine (APPS), and Okta (OKTA) were at the bottom of the list, all with over 5% of declines.
-=x=-=x=-=x=-=x=-=x=-=x=-=x=-
Looking ahead
Tuesday will bring Exports, Imports and Trade Balance data before market open. Factory Orders data will be released after market open and API Weekly Crude Oil Stock levels will be released after market close.
Tuesdays earnings reports will include Pfizer (PFE), T-Mobile (TMUS), CVS (CVS), Zillow (Z), Verisk (VRSK), Lyft (LYFT), Skillz (SKLZ).
The earnings list is long, so check your portfolio for earnings events so you are not surprised.
-=x=-=x=-=x=-=x=-=x=-=x=-=x=-
Trends, Support and Resistance
The index is below the 14,000 support/resistance area. Without a boost, we can expect there to be resistance before passing back above the line again.
The trend line from the 3/5 low, points to a +2.16% advance, that would be back above 14,000 and just below the all-time high.
The five-day trend line points to a sideways move with a small -0.05% decline.
The one-day trend line points to a -0.75% loss.
-=x=-=x=-=x=-=x=-=x=-=x=-=x=-
Wrap-up
Investors are back into reopening trades, sending cyclicals back to the top of the sector list today. The rotation was tough for big tech and growth stocks. But manufacturing data in the morning brought yields and the US Dollar down which could be good for the growth plays in the coming days.
There are lots of earnings reports this week. Watch for positive reports and how the market reacts to them. Will last week's cold reception of positive reports continue?
Stay healthy and trade safe!

Market Week in Review - 4/26/2021 - 4/30/2021
Summary: The week began with continued momentum from the end of the previous week as investors speculated ahead of earnings reports from the biggest most influential companies in the market. Those companies gained on Monday as investors became more bullish, sending the put/call ratio to an overly bullish level. The result was that much of the positive earnings reports were already priced into the market, setting expectations even higher.
Notes
The Market Week in Review is my weekend homework where I look over what happened in the previous week and what might come in the next week.
I do occasionally have some errors or typos and will correct them in my blog or in the comments on TradingView. I do not have an editor and do this in my free time.
If you find this helpful, please let me know in the comments. I am also more than happy to add new perspectives and data points if you have ideas.
The structure is the following:
A recap of the daily updates that I do here on TradingView.
The Meaning of Life, a view on the past week
What's coming in the next week
The Bullish View, The Bearish View
Key index levels to watch out for
Wrap-up
If you have been following my daily updates, you can skip down to the “The Meaning of Life”. If not, then this first part is a great play-by-play recap for the week. Click the daily charts for more detail on sectors, indexes and market leaders each day.
-=x=-=x=-=x=-=x=-=x=-=x=-=x=-
Monday, April 26, 2021
Facts: +0.87%, Volume higher, Closing range: 89%, Body: 64%
Good: Move up on higher volume and broadly shared gains
Bad: Nothing
Highs/Lows: Higher high, higher low
Candle: Longer lower wick from dip at open, short upper wick after testing new high
Advance/Decline: Three advancing stocks for every two declining stocks
Indexes: SPX (+0.18%), DJI (-0.18%), RUT (+1.15%), VIX (+1.79%)
Sectors: Energy (XLE +0.67%) and Materials (XLB +0.59%) were top. Utilities (XLU -0.57%) and Consumer Staples (XLP -1.12%) were bottom.
Expectation: Higher
Momentum from the end of last week continued into Monday as markets open the week higher and the S&P 500 and Nasdaq set new records. There are some signs that investors are rotating out of safe bets and buying up speculative positions ahead of earnings reports.
The Nasdaq had a record-setting close, ending the with a +0.87% gain and fell just shy of setting a new all-time high price. Volume was higher and advancing stocks outnumbered declining stocks, great bullish signals for the rally. The closing range of 89% comes after a small dip before close. A longer lower wick was created by a dip just after open before the bulls quickly took over.
-=x=-=x=-=x=-=x=-=x=-=x=-=x=-
Tuesday, April 27, 2021
Facts: -0.34%, Volume higher, Closing range: 24%, Body: 75%
Good: Higher high, higher low
Bad: Gap up at open, but couldn't hold on, distribution day on higher volume
Highs/Lows: Higher high, higher low
Candle: No upper wick, thick red body with a short lower wick
Advance/Decline: Two declining stocks for each advancing stock
Indexes: SPX (-0.02%), DJI (+0.01%), RUT (+0.14%), VIX (-0.45%)
Sectors: Energy (XLE +1.21%) and Industrials (XLI +0.83%) were top. Health (XLV -0.58%) and Utilities (XLU -0.77%) were bottom.
Expectation: Sideways
The Nasdaq opened with a gap up but couldn't hold on, selling off briskly in the morning along with the other major indexes. Eventually positive consumer confidence numbers and continued growing demand outlook from OPEC helped the markets to settle down and end the day with a relatively small pull back overall.
The Nasdaq closed with a -0.34% decline on higher volume. The distribution day resulted in a 75% red body that ended with a 25% closing range. A small lower wick was formed in the morning before the index found support above 14,000. The higher high and higher low continue an uptrend since last Wednesday. There were two declining stocks for every advancing stock.
-=x=-=x=-=x=-=x=-=x=-=x=-=x=-
Wednesday, April 28, 2021
Facts: -0.28%, Volume lower, Closing range: 17%, Body: 32%
Good: Lower volume, sideways movement, with support above 14,000
Bad: Lower high and lower low with a low closing range
Highs/Lows: Lower high, lower low
Candle: Long upper wick above a small red body and low closing range
Advance/Decline: Just slightly more declining stocks than advancing stocks
Indexes: SPX (-0.08%), DJI (-0.48%), RUT (+0.13%), VIX (-1.59%)
Sectors: Energy (XLE +3.45%) and Communications (XLC +0.92%) were top. Real Estate (XLRE -0.35%) and Technology (XLK -0.93%)
Expectation: Sideways or Higher
The market attempted to rally a few times today but came back to rest at intraday lows. The good news is those lows seemed to be support areas that the bears could not bust below. The two intraday rallies came in the morning and afternoon, the first possibly on earnings reactions and the second on no surprises from the FOMC press conference.
The Nasdaq closed with a -0.28% loss in a day after testing and getting support around 14,050 three times. The long upper wick was formed from the morning and afternoon rally. The small 32% red body rests in the bottom of the candle above a 17% closing range and a small lower wick. Volume was lower for the day and there were just slightly more declining stocks than advancing stocks.
-=x=-=x=-=x=-=x=-=x=-=x=-=x=-
Thursday, April 29, 2021
Facts: +0.22%, Volume higher, Closing range: 50%, Body: 47%
Good: New all-time high, higher volume, recovery from morning selling in afternoon
Bad: Couldn't hold the high, lower low
Highs/Lows: Higher high, lower low
Candle: Outside day, long lower wick with a thick red body in upper half of candle
Advance/Decline: Just slightly more declining stocks than advancing stocks
Indexes: SPX (+0.68%), DJI (+0.71%), RUT (-0.38%), VIX (+1.91%)
Sectors: Communications (XLC +2.77%) and Financial (XLF +1.78%) were top. Technology (XLK -0.08%) and Health (XLV -0.40%) were bottom.
Expectation: Sideways or Higher
We got higher, we got lower and we got sideways. It was a whiplash day for the markets that saw record highs be broken right before a painful morning sell-off. Then the afternoon rally brought most of the major indexes back into positive territory and left the S&P 500 at another all-time record close.
The Nasdaq ended the day with a +0.22% gain, a close that is within the highs and lows of the week, marking a sideways move. Volume was higher as the morning high set a record for the index, before selling off to a morning low which is also a low for the week. Finally in the afternoon, the index climbed back to the positive, leaving us with a long lower wick underneath a 47% red body and 50% closing range. There were nearly two declining stocks for every advancing stock.
-=x=-=x=-=x=-=x=-=x=-=x=-=x=-
Friday, April 30, 2021
Facts: -0.85%, Volume lower, Closing range: 15%, Body: 6%
Good: Not much
Bad: Failed rally in the morning, newer low in the afternoon
Highs/Lows: Lower high, lower low
Candle: Long upper wick and thin red body show the failed morning rally
Advance/Decline: Three declining stocks for every advancing stock
Indexes: SPX (-0.72%), DJI (-0.54%), RUT (-1.26%), VIX (+5.68%)
Sectors: Utilities (XLU +0.79%) and Real Estate (XLRE +0.66%) were top sectors. Technology (XLK -1.36%) and Energy (XLE -2.53%) were bottom.
Expectation: Lower
It was not a great end to the month of April, with a failed rally in the morning that turned into lower lows in the afternoon. Investors are watching economic data closely, especially focused on measures of inflation driving expectations for an overheated economy.
The Nasdaq closed the last day of April with a -0.85% decline on lower volume. The 6% body under a long upper wick and 15% closing range are the result of a morning rally attempt that faded quickly and turned into lower lows at the end of the day. The index was able to close just above the intraday low. Three stocks declined for every advancing stock.
-=x=-=x=-=x=-=x=-=x=-=x=-=x=-
The Meaning of Life (View on the Week)
The week began with continued momentum from the end of the previous week as investors speculated ahead of earnings reports from the biggest most influential companies in the market. Those companies gained on Monday as investors became more bullish, sending the put/call ratio to an overly bullish level. The result was that much of the positive earnings reports were already priced into the market, setting expectations even higher.
The first warning sign that the speculation may have fragile support was the reaction to Tesla's earnings report. Despite beating earnings and revenue estimates, the challenges faced by the company was too much for investors to remain positive even though none of those challenges were news. Next came a positive report by Microsoft, met with selling in after hours. AMD's positive report turned from gains in aftermarket to losses the next day. Apple and Amazon both turned gains into losses after positive reports.
The only sector that was able to stay bullish was communications, with positive reports from Alphabet (GOOGL) and Facebook (FB) being met by investors with big gains. The two companies stand to benefit immensely from the increase in consumer activity as advertisers will increase spending to capture share of pocket books.
The result was a choppy week for the indexes. The Nasdaq gapped up on Tuesday, but ended the day with losses. Those losses turned into more losses on Wednesday. Then a huge outside day hit on Thursday, setting a new all-time high for the index, but then dipping to the weekly low before ending the day with a small gain. Friday ended the week with another swing, but closing right where it opened.
Small caps and the Russell 2000 (RUT) outperformed early in the week, but the rally ended after Wednesday and the index dropped on Thursday and Friday.
With so many positive earnings reports, why the negative reaction in the market? Inflation. It's looming like Godzilla emerging from the ocean, meeting up with King Kong (the Fed) and fighting over future outlook. Inflation is a necessary part of the economy growing back to pre-pandemic levels. And the Fed says that the inflation will be transitionary and they expect it to drop back to around or below 2% by end of the year. But analysts aren't sure. They fear that Inflation will eventually cause the Fed to take action and rase interest rates.
So in the meantime, inflation is going to often cause good economic news to be met with a negative nelly reaction from investors. That seems to have driven much of what we saw this week.
The Nasdaq closed down -0.39% for the week on higher volume. The closing range was a dismal 8% with a small body sitting in the bottom half of the candle. The upper wick is formed from the attempted rallies on Tuesday and Thursday.
The S&P 500 (SPX) gained +0.02% for the week. The Dow Jones Industrial average (DJI) lost -0.50%. The Russell 2000 (RUT) declined -0.24%.
The Russell 2000 (RUT) gained +0.41% for the week thanks to a strong small cap performance late in the week. The S&P 500 lost -0.13% for the week. The Dow Jones Industrial average (DJI) declined -0.46%.
The VIX volatility index rose +7.39% and is trending up the last two weeks.
Energy ( XLE ) led the weekly sector list for the first time since the first week of March. The sector was helped by oil prices that rose on Tuesday and Wednesday, and positive earnings reports from Exxon Mobile and Chevron.
Financials ( XLF ) and Communications ( XLC ) stocks solidified second and third place with strong opens on Thursday. Financials was boosted by positive earnings reports from Capital One and S&P Global . Communications got a big lift from Alphabet and Facebook , as advertising revenues soar amidst consumers getting back to spending.
Despite several positive earnings reports in the sector, Technology ( XLK ) ended the week in last place. Investor outlook appears to be that these big tech companies will not continue the same amount of growth in the next few quarters, especially compared to the previous year's numbers.
The US 30y treasury bond and US 10y treasury note yields both declined for the week. The US 2y note yield also declined. The yield curve is slightly steeper than the previous week, but spreads are still trending sideways for the past two months.
Both the High Yield Corporate Bond (HYG) prices advanced while Investment Grade Bond (LQD) prices declined.
The US Dollar (DXY) had its first gain after several weeks of declines. It advanced +0.51% this week.
Silver (SILVER) and Gold (GOLD) declined -0.38% and -0.47% for the week.
Crude Oil (CRUDEOIL1!) advanced +1.53%.
Timber (WOOD) declined for another week, losing -0.70%
Copper (COPPER1!) advanced +2.58% and Aluminum (ALI1!) advanced +1.71%. That's four weeks of advances for the two metals required for infrastructure and manufacturing activity.
This growth/value comparison we've been tracking is starting to trend back in favor of value.
-=x=-=x=-=x=-=x=-=x=-=x=-=x=-
The Big Four Mega-caps
The big four mega-caps had mixed weeks. Amazon (AMZN) and Alphabet (GOOGL) ended the week with gains. Amazon advanced +3.79% for the week and Alphabet advanced +2.33%. Apple (AAPL) and Microsoft (MSFT) could not hold onto gains early in the week, despite both releasing positive earnings and revenue reports. Apple (AAPL) retreated -2.13% while Microsoft lost -3.43%. All big four mega-caps continue to trade above 10w and 40w moving average lines.
-=x=-=x=-=x=-=x=-=x=-=x=-=x=-
The Four Recovery Stocks
I picked four recovery stocks to track against the indexes and other indicators in this weekly report. All four had gains this week. Marriott (MAR) had the smallest gain with a +0.11% advanced. Carnival Cruise Lines (CCL) and Delta Airlines (DAL) gained +2.53% and +2.45%. Exxon Mobil (XOM) exited the week with a +3.01% gain.
-=x=-=x=-=x=-=x=-=x=-=x=-=x=-
Investor Sentiment
The put/call ratio (PCCE) closed the week at 0.790, showing a little more caution among investors. On Monday it was a 0.492, very bullish. A contrarian indicator, when the put/call ratio is below 0.7, it signals overly bullish sentiment and could mean an overbought market.
The CNN Fear & Greed index is on the greed side but not far off neutral.
The NAAIM exposure index moved up to 103.72. That's the first time exposure moved above 100 since February.
-=x=-=x=-=x=-=x=-=x=-=x=-=x=-
The Week Ahead
Monday
Monday will start the month of May with Manufacturing data, which should show growth in the sector given the other economic recovery data showing demand for goods.
Earnings reports on Monday will include Alibaba (BABA), Estee Lauder (EL), Loews (LO), SolarEdge (SEDG), and Avis (CAR).
Tuesday
Tuesday will bring Exports, Imports and Trade Balance data before market open. Factory Orders data will be released after market open and API Weekly Crude Oil Stock levels will be released after market close.
Tuesdays earnings reports will include Pfizer (PFE), T-Mobile (TMUS), CVS (CVS), Zillow (Z), Verisk (VRSK), LYFT (LYFT), Skillz (SKLZ).
Wednesday
ADP Nonfarm Employment data will be released on Wednesday morning. In addition, the purchasing manager indexes for Services and Non-Manufacturing sectors will be released after the market opens. Crude Oil Inventories will be updated in the morning as well.
PayPal (PYPL), Uber (UBER), Boking (BKNG), General Motors (GM), MercadoLibre (MELI), Twilio (TWLO), Rocket (RKT), Hilton (HLT), Etsy (ETSY), HubSpot (HUBS), 10x Genomics (TXG), Qorvo (QRVO), Zynga (ZNGA), Fastly (FSLY), Redfin (RDFN), Palomar (PLMR) is an abbreviated list of a massive number of earnings reports for Wednesday.
Thursday
The weekly Initial Jobless Claims numbers will be released on Thursday morning as well as Nonfarm Productivity and Unit Labor Costs.
Thursday will be another busy day of earnings reports. Linde (LIN), Anheuser Busch (BUD), Volkswagen (BWAPY), Square (SQ), Fidelity (FIS), Moderna (MRNA), Roku (ROKU), Expedia (EXPE), Beyond Meat (BYND), AMC Entertainment (AMC) are some of the interesting reports.
Friday
More labor statistics will be released on Friday with the Average Hourly Earnings data, Nonfarm Payrolls, Labor Participation data and the Unemployment rate all released before market open.
Adidas (ADDYY), BMW (BMWYY), DraftKings (DKNG), Cinemark (CNK) are a few of the companies to report on Friday and end a big earnings week.
This another super busy week of earnings reports. Check your own portfolio for earnings dates so you aren't surprised.
-=x=-=x=-=x=-=x=-=x=-=x=-=x=-
The Bullish Side
It may not be quite the week we were looking for, but we got a higher high and a higher low, setting up the markets for an uptrend from here. Even days with a dip, the index still seems to be closing around 14,000 which can be a support level from which to move higher.
The Fed has stood strong on the statement that they would not touch interest rates despite inflation going above 2%.
Now that the price data this past week is behind us, investors can move their focus off inflation and focus on the underlying economic strength that will be shown in manufacturing data, purchasing index data and employment data. That should put more confidence behind the positive earnings reports this past week.
The treasury yield curve remains about the same over the past two months, easing fears that longer term interest rates would outpace short term rates and make money more expensive for growth companies. The US Dollar bounced off of recent lows on Friday, but remains low compared to the past year. That should help large multinationals.
Another week of good earnings reports might be enough to turn sentiment upward and get a more positive reaction from investors.
-=x=-=x=-=x=-=x=-=x=-=x=-=x=-
The Bearish Side
The failed rally attempts among great earnings reports could just be the beginning. Investors don't trust that market leaders can continue the amazing growth they've showed over the past year. They also see headwinds coming if inflation continues at a high rate, causing a reaction by the Fed.
The looming inflation numbers mean that even with great economic news, investors might just see added fuel to the fire of an overheated economy that needs to be controlled with higher interest rates. Combine that with a breakout of the US Dollar from a descent since the beginning of April and the two could cause quite an impact to valuations for the big multinational companies.
The advance/decline ratio was above 1.0 only six times in April. Meaning most days in April there were more declining stocks than advancing stocks on the Nasdaq. That might be different in the broader market, but it doesn't bode well for big tech and growth stocks.
-=x=-=x=-=x=-=x=-=x=-=x=-=x=-
Key Nasdaq Levels to Watch
The Nasdaq closed just below 14,000 this past week, but seemed to return to the area after dips. We want to get above that line and stay there to support further gains and break into new all-time highs.
On the positive side, the levels are:
14,000 will be the first line to pass, also taking the index above the 10d moving average.
The all-time high is at 14,211.57 is the all-time high and the high of this week.
14,850 is the middle line of the channel from the March 2020 bottom. The index has been in the channel, but below the midline for the past nine weeks.
On the downside, there are a few key levels:
The low of this past week is 13,941.63. Let's get a higher low for next week.
The 21d exponential moving average is at 13,860.07.
A previous support area is around 13,600.
The 50d moving average has been moving sideways and is at 13,511.49.
The lower line of the channel from the March 2020 bottom is around 13,515 for next week.
-=x=-=x=-=x=-=x=-=x=-=x=-=x=-
Wrap-up
Can it get any better? That's what investors want to know. The economy is super charged for recover and the Fed continues support. But the more overheated the economic growth becomes, the more nervous investors will get. That's why seemingly positive news is being met with dips in the market.
So the next week, we'll watch for reactions to earnings reports and economic news. If the reports are positive and the reactions are good, then we can rest easy. Otherwise, we'll be watching for those key levels to see just how nervous investors have become. If we lose support in some of the key levels, then a defensive position will be warranted.
Lots of earning reports next week. Keep your eye on your portfolio so you are not surprised.
Good luck, stay healthy and trade safe!

Daily Market Update for 4/30Summary: It was not a great end to the month of April, with a failed rally in the morning that turned into lower lows in the afternoon. Investors are watching economic data closely, especially focused on measures of inflation driving expectations for an overheated economy.
Notes
Ideas always welcome in the comments. Errors will be amended as comments on TradingView or corrected inline in my blog.
-=x=-=x=-=x=-=x=-=x=-=x=-=x=-
Friday, April 30, 2021
Facts: -0.85%, Volume lower, Closing range: 15%, Body: 6%
Good: Not much
Bad: Failed rally in the morning, newer low in the afternoon
Highs/Lows: Lower high, lower low
Candle: Long upper wick and thin red body show the failed morning rally
Advance/Decline: Three declining stocks for every advancing stock
Indexes: SPX (-0.72%), DJI (-0.54%), RUT (-1.26%), VIX (+5.68%)
Sectors: Utilities (XLU +0.79%) and Real Estate (XLRE +0.66%) were top sectors. Technology (XLK -1.36%) and Energy (XLE -2.53%) were bottom.
Expectation: Lower
-=x=-=x=-=x=-=x=-=x=-=x=-=x=-
Market Overview
It was not a great end to the month of April, with a failed rally in the morning that turned into lower lows in the afternoon. Investors are watching economic data closely, especially focused on measures of inflation driving expectations for an overheated economy.
The Nasdaq closed the last day of April with a -0.85% decline on lower volume. The 6% body under a long upper wick and 15% closing range are the result of a morning rally attempt that faded quickly and turned into lower lows at the end of the day. The index was able to close just above the intraday low. Three stocks declined for every advancing stock.
The S&P 500 (SPX) closed down -0.85% after a record close the previous day. The Dow Jones Industrial (DJI) closed down -0.54%. The Russell 2000 (RUT) was the worst performing index of the day with a -1.26% decline.
The VIX volatility index advanced +5.68%.
Utilities (XLU +0.79%) and Real Estate (XLRE +0.66%) were top sectors as investors fled for safety within equity markets. Only four sectors closed the day with gains. Technology (XLK -1.36%) and Energy (XLE -2.53%) were the worst performing sectors for the day.
-=x=-=x=-=x=-=x=-=x=-=x=-=x=-
Economic Indicators
The US Dollar (DXY) had advanced +0.73% on very bullish consumer data.
The US 30y treasury bond yield remained flat while the 10y and 2y note yields declined.
High Yield Corporate Bond (HYG) prices declined while the Investment Grade Corporate Bond (LQD) prices advanced.
Silver (SILVER) and Gold (GOLD) declined. Crude Oil (CRUDEOIL1!) declined. Timber (WOOD) declined. Copper (COPPER1!) and Aluminum (ALI1!) declined.
-=x=-=x=-=x=-=x=-=x=-=x=-=x=-
Investor Sentiment
The put/call ratio rose to 0.790. The put/call ratio (PCCE) is a contrarian indicator that shows overly bullish or overly bearish investor behavior. The 0.7 level is considered normal. As it approaches 0.60 (overly bullish) and below, watch for a possible pullback in the market.
The CNN Fear & Greed index is moved back toward neutral.
-=x=-=x=-=x=-=x=-=x=-=x=-=x=-
Market Leaders
All four big mega-caps declined for the day. Microsoft (MSFT) recovered from lows to close just -0.13% and a nice thick green candle on lower volume. It's trading below its 21d EMA. Apple (AAPL) declined -1.51% and closed just above the 21d EMA. Amazon (AMZN) declined -0.11% and Alphabet (GOOGL) declined -1.64%. Both are still trading well above key moving average lines and near all-time highs. Amazon could not hold onto aftermarket gains from a positive earnings report. A bit of a theme for the week.
Tesla (TSLA), Netflix (NFLX), Verizon (VZ) and Proctor & Gamble (PG) were the top mega-cap gainers for the day. At the bottom of the mega-cap list were Exxon Mobile (XOM), ASML Holdings (ASML), PayPal (PYPL) and Nvidia (NVDA).
Only a handful of the daily update growth stocks rose for the day. Digital Turbine (APPS), NIO (NIO), Moderna (MRNA) and Snowflake (SNOW) topped the list. At the bottom of the list was Twitter (TWTR) with a huge -15.16% declined after providing disappointing guidance on user growth. Roku (ROKU), Solar Edge (SEDG) and Etsy (ETSY) were also at the bottom of the list.
-=x=-=x=-=x=-=x=-=x=-=x=-=x=-
Looking ahead
Monday will kick off the month of May with Manufacturing data, which should show growth in the sector given the other economic recovery data.
Earnings reports on Monday will include Alibaba (BABA), Estee Lauder (EL), Loews (LO), SolarEdge (SEDG), and Avis (CAR).
-=x=-=x=-=x=-=x=-=x=-=x=-=x=-
Trends, Support and Resistance
The index is back just below the 14,000 line. If it dips again, expect some resistance at this line before making new highs.
The trend line from the 3/5 low, points to a +1.65% advance. The five-day trend line results in a +0.16% gain.
The one-day trend line points to a -0.61% loss.
-=x=-=x=-=x=-=x=-=x=-=x=-=x=-
Wrap-up
The week was full of positive earnings reports that turned into lower prices for the stocks. Investors seem worried that some of these outperforming companies will not be able to hold the growth into the next few quarters, especially relative to the previous year. Investors were especially sensitive to any guidance that was neutral to negative for the coming quarters.
In addition to that sentiment, investors are watching economic indicators very closely. Although inflation is a positive sign that economic activity is returning, driving demand faster than supply, too much inflation could cause a reaction from the Fed. Not everyone believes the Fed will sit back indefinitely waiting for transitional inflation to subside.
That results in investors moving into safer assets as they look over the coming quarters. Still, reactions are sometimes temporary and we could see investments rotate back into equities. For now, the expectation for the index is lower.
Stay healthy and trade safe!

Nasdaq looking bearishFell thru a rising wedge pattern Thursday and closed Friday with gravestone doji. Also finish the weekly with a bearish shooting star. RSI has been showing divergence since January. Nasdaq tried to break through that divergence and rejected on April 13th, 16th, 26th, and 29th.
Macd - Death cross
It's coming down; the question is how far. The most important level I'm watching is at 13620 Fib ext 1. If it breaks through that area that would be a double and then we can honestly expect a lower move to close some of those gaps left behind in April's rally.
Lose your opinion, not your money

Nasdaqheads up on the markets, looking like a bear flag, new tax plan making sellers come out of the closet. Stoch is energy and some patterns that help . Vix bolly bands super tight for a move also and divergence included

IXIC long and short price predictions the highest one is about 14,700 and the lowest is about 11,200
i think these are very believable in the case of strong bull and bear cases
we are in a consolidation range right now and May can be a real deciding month
RIP to high multiple stocks tho
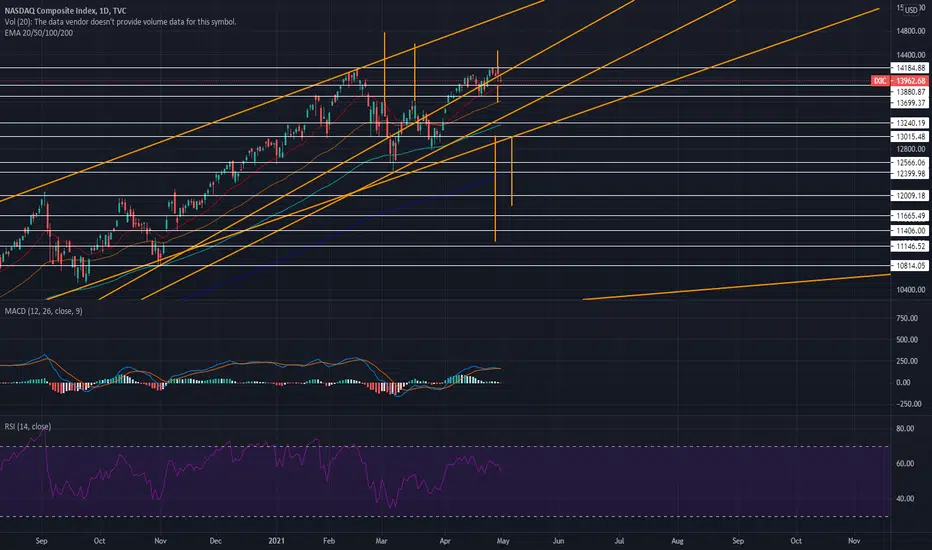
Daily Market Update for 4/29Summary: We got higher, we got lower and we got sideways. It was a whiplash day for the markets that saw record highs be broken right before a painful morning sell-off. Then the afternoon rally brought most of the major indexes back into positive territory and left the S&P 500 at another all-time record close.
Notes
Ideas always welcome in the comments. Errors will be amended as comments on TradingView or corrected inline in my blog.
-=x=-=x=-=x=-=x=-=x=-=x=-=x=-
Thursday, April 29, 2021
Facts: +0.22%, Volume higher, Closing range: 50%, Body: 47%
Good: New all-time high, higher volume, recovery from morning selling in afternoon
Bad: Couldn't hold the high, lower low
Highs/Lows: Higher high, lower low
Candle: Outside day, long lower wick with a thick red body in upper half of candle
Advance/Decline: Just slightly more declining stocks than advancing stocks
Indexes: SPX (+0.68%), DJI (+0.71%), RUT (-0.38%), VIX (+1.91%)
Sectors: Communications (XLC +2.77%) and Financial (XLF +1.78%) were top. Technology (XLK -0.08%) and Health (XLV -0.40%) were bottom.
Expectation: Sideways or Higher
-=x=-=x=-=x=-=x=-=x=-=x=-=x=-
Market Overview
We got higher, we got lower and we got sideways. It was a whiplash day for the markets that saw record highs be broken right before a painful morning sell-off. Then the afternoon rally brought most of the major indexes back into positive territory and left the S&P 500 at another all-time record close.
The Nasdaq ended the day with a +0.22% gain, a close that is within the highs and lows of the week, marking a sideways move. Volume was higher as the morning high set a record for the index, before selling off to a morning low which is also a low for the week. Finally in the afternoon, the index climbed back to the positive, leaving us with a long lower wick underneath a 47% red body and 50% closing range. There were nearly two declining stocks for every advancing stock.
The S&P 500 closed at a record high, gaining +0.68% for the day. The Dow Jones Industrial average (DJI) closed the day with a +0.71% gain. The Russell 2000 (RUT) underperformed the other indexes for the first time in several days, losing -0.38%.
The VIX volatility index advanced +1.91%.
Communications (XLC +2.77%) was a top sector thanks to earning reports from Alphabet earlier in the week and Facebook yesterday. Financials (XLF +1.78%) was the second best of the day. Technology (XLK -0.08%) and Health (XLV -0.40%) were the only losing sectors for the day.
-=x=-=x=-=x=-=x=-=x=-=x=-=x=-
Economic Indicators
The US Dollar (DXY) had advanced +0.04%.
The US 30y treasury bond and 10y note yield advanced while the 2y note yield both declined. The yield curve is beginning to steepen again with the spread between long term and short term yields widening over the past week.
High Yield Corporate Bond (HYG) prices rose while the Investment Grade Corporate Bond (LQD) prices declined.
Silver (SILVER) and Gold (GOLD) declined. Crude Oil (CRUDEOIL1!) advanced. Timber (WOOD) advancedslightly. Copper (COPPER1!) declined while Aluminum (ALI1!) advanced.
-=x=-=x=-=x=-=x=-=x=-=x=-=x=-
Investor Sentiment
The put/call ratio ended the day at 0.585. The put/call ratio (PCCE) is a contrarian indicator that shows overly bullish or overly bearish investor behavior. The 0.7 level is considered normal. As it approaches 0.60 (overly bullish) and below, watch for a possible pullback in the market.
The CNN Fear & Greed index is moving more toward the extreme greed range.
The NAAIM money manager exposure index topped for the first time since February, coming in at 103.72 this week.
-=x=-=x=-=x=-=x=-=x=-=x=-=x=-
Market Leaders
Alphabet (GOOGL) it's advance after a great earnings report earlier this week, gaining +1.53% today. Amazon (AMZN) gained +0.37% ahead of earnings today. Aftermarket the stock is +2.3% on a positive reaction from earnings. Apple (AAPL) ended the day with a -0.07% after a positive earnings report that sent the stock up +2.61% before fading. Microsoft (MSFT) continues a second day of declines, losing -0.81% today and closing below its 21d EMA.
Facebook (FB) topped the list of mega-caps with a +7.3% gain and helping the communications sector top the sector list for the day. Comcast (CMCSA), Bank of America (BAC) and Alphabet (GOOGL) also topped the list with greater than 2% gains. At the bottom of the list were Tesla (TSLA), Mastercard (MA), PayPal (PYPL) and Alibaba (BABA).
It was not a great day for growth stocks, with most of the stocks in the daily update list declining for the day. Pinterest (PINS), Dr Horton (DHI), Zynga (ZNGA) were among the few gainers. MongoDB (MDB), Ehang Holdings (EH), NIO (NIO) and ServiceNow (NOW) had losses over 5% with ServiceNow declining -9.37%.
-=x=-=x=-=x=-=x=-=x=-=x=-=x=-
Looking ahead
On Thursday, new GDP data will be released which is expected to be 6.5%. Initial Jobless Claims data will hopefully continue to fall. Pending Home Sales data will be released after market open.
Friday will close the big earnings week with Alibaba (BABA), Exxon Mobil (XOM), AbbVie (ABBV), Chevron (CVX), AstraZeneca (AZN), Johnson Controls (JCI), and Komatsu (KMTUY).
Be sure to check your portfolio for earnings reports so you are not surprised.
-=x=-=x=-=x=-=x=-=x=-=x=-=x=-
Trends, Support and Resistance
The index set a new all-time high today, then dipped between the 14,000 support area before the bulls came in to end back above the key level.
The trend line from the 3/5 low, points to a +0.99% advance. The five-day trend line results in a +0.71% gain. Despite the lower close, the one-day trend line points to a +0.20% for tomorrow.
-=x=-=x=-=x=-=x=-=x=-=x=-=x=-
Wrap-up
It was a whiplash day with a mixed finish. A record close for the S&P 500, an indecisive candle on the RUT, and a mediocre finish for the Nasdaq. Move earnings have been met with positive reaction after hours only to turn into negative moves the following day. But overall the market is still in an uptrend.
We'll look for momentum from the today's afternoon to carry into tomorrow's morning, hopefully boosted by positive economic news around employment and consumer sentiment and behaviors. The expectations is still for sideways or higher and if we get lower, we'll revisit what might be driving investors in one direction or the other.
Stay healthy and trade safe!

Daily Market Update for 4/28Summary: The market attempted to rally a few times today but came back to rest at intraday lows. The good news is those lows seemed to be support areas that the bears could not bust below. The two intraday rallies came in the morning and afternoon, the first possibly on earnings reactions and the second on no surprises from the FOMC press conference.
Notes
Ideas always welcome in the comments. Errors will be amended as comments on TradingView or corrected inline in my blog.
-=x=-=x=-=x=-=x=-=x=-=x=-=x=-
Wednesday, April 28, 2021
Facts: -0.28%, Volume lower, Closing range: 17%, Body: 32%
Good: Lower volume, sideways movement, with support above 14,000
Bad: Lower high and lower low with a low closing range
Highs/Lows: Lower high, lower low
Candle: Long upper wick above a small red body and low closing range
Advance/Decline: Just slightly more declining stocks than advancing stocks
Indexes: SPX (-0.08%), DJI (-0.48%), RUT (+0.13%), VIX (-1.59%)
Sectors: Energy (XLE +3.45%) and Communications (XLC +0.92%) were top. Real Estate (XLRE -0.35%) and Technology (XLK -0.93%)
Expectation: Sideways or Higher
-=x=-=x=-=x=-=x=-=x=-=x=-=x=-
Market Overview
The market attempted to rally a few times today but came back to rest at intraday lows. The good news is those lows seemed to be support areas that the bears could not bust below. The two intraday rallies came in the morning and afternoon, the first possibly on earnings reactions and the second on no surprises from the FOMC press conference.
The Nasdaq closed with a -0.28% loss in a day after testing and getting support around 14,050 three times. The long upper wick was formed from the morning and afternoon rally. The small 32% red body rests in the bottom of the candle above a 17% closing range and a small lower wick. Volume was lower for the day and there were just slightly more declining stocks than advancing stocks.
The Russell 2000 (RUT) continues to outperform with a +0.13% advance today. The S&P 500 (SPX) declined -0.08% while the Dow Jones Industrial average (DJI) declined -0.48%.
The VIX volatility index declined -1.59%. The combination of low volatility, along with low volume decline, plus the support at intraday lows is a good signal.
Energy (XLE +1.21%) and Communications (XLC +0.92%) were the top sectors of the day. Energy was buoyed by positive data on oil demand. Communications rose on excitement over Alphabet's surprise beat on earnings. Real Estate (XLRE -0.35%) and Technology (XLK -0.93%) were the bottom performers for the day.
-=x=-=x=-=x=-=x=-=x=-=x=-=x=-
Economic Indicators
The US Dollar (DXY) had declined -0.32%.
The US 30y treasury bond yield remained flat. The US 10y and 2y treasury note yields both declined.
High Yield Corporate Bond (HYG) prices rose while the Investment Grade Corporate Bond (LQD) prices stayed flat.
Silver (SILVER) and Gold (GOLD) advanced. Crude Oil (CRUDEOIL1!) advanced. Timber (WOOD) declined slightly. Copper (COPPER1!) and Aluminum (ALI1!) also had small declines.
-=x=-=x=-=x=-=x=-=x=-=x=-=x=-
Investor Sentiment
The put/call ratio rose to 0.602. The put/call ratio (PCCE) is a contrarian indicator that shows overly bullish or overly bearish investor behavior. The 0.7 level is considered normal. As it approaches 0.60 (overly bullish) and below, watch for a possible pullback in the market.
The CNN Fear & Greed index remains just on the greed side of the neutral area.
-=x=-=x=-=x=-=x=-=x=-=x=-=x=-
Market Leaders
Alphabet (GOOGL) and Microsoft (MSFT) had opposite reactions to positive earnings reports, likely based on investor reaction to guidance given during the releases. Alphabet gapped higher with a +2.97% gain for the day. Microsoft (MSFT) gapped lower with a -2.83% loss for the day. Both break out in opposite directions from their respective bases. Microsoft's base broke downward but did get support at the 21d EMA line. Amazon (AMZN) continues a breakout from earlier this week with a +1.20% gain today. Apple (AAPL) moved lower with a -0.60% loss, but remains within its base.
Exxon Mobile (XOM), Mastercard (MA) and Visa (V) join Alphabet as the top four mega-caps for the day. Microsoft (MSFT), Tesla (TSLA), Taiwan Semiconductor (TSM) and ASML Holdings (ASML) were the bottom four.
UP Fintech (TIGR), FUTU Holdings (FUTU), SNAP (SNAP) and Etsy (ETSY) topped the daily update growth stock list. At the bottom of the list were Enphase (ENPH) and Pinterest (PINS) with big -14% losses.
AMD had a very positive post market reaction from yesterday's earnings report, but couldn't hold the gains and ended the day with a -1.40% loss.
-=x=-=x=-=x=-=x=-=x=-=x=-=x=-
Looking ahead
On Thursday, new GDP data will be released which is expected to be 6.5%. Initial Jobless Claims data will hopefully continue to fall. Pending Home Sales data will be released after market open.
We will also get any reaction from Biden's remarks to congress which are expected to have updates on economic support as well as taxes to pay for infrastructure plans.
Earnings reports have been mostly positive this week, but reactions have been mixed. On Thursday, reports include Amazon (AMZN), Mastercard (MA), Comcast (CMCSA), Thermo Fisher Scientific (TMO), McDonald's (MCD), Baidu (BIDU), Atlassian (TEAM), Twitter (TWTR), Fortinet (FTNT), Royal Caribbean (RCL), and Logitech (LOGI).
Be sure to check your portfolio for earnings reports so you are not surprised.
-=x=-=x=-=x=-=x=-=x=-=x=-=x=-
Trends, Support and Resistance
The index declined today but stayed about the 14,000 support area.
The trend line from the 3/5 low, points to a +0.99% advance. The five-day trend line results in a +0.71% gain. Despite the lower close, the one-day trend line points to a +0.20% for tomorrow.
-=x=-=x=-=x=-=x=-=x=-=x=-=x=-
Wrap-up
A few positive earnings reports weren't enough to give the markets the lift they needed, although the bulls certainly made attempts during the day. Nervousness remained over additional earnings reports coming later today and this week. And investors await remarks from Biden that will include proposals around new taxes. The capital gains tax would seem to be priced in by now, but any further surprises from the President's speech could have a negative reaction.
However, given the support the index got at intraday lows above 14,000 and the positive earnings reports in after hours, it's reasonable to expect the markets to move higher tomorrow. At a minimum they should move sideways. If they move lower, then that should be a red flag that something else is going on.
Stay healthy and trade safe!

Nasdaq short term updateNasdaq is continuing on its bearish rising wedge pattern. In my last post I charted out its possible path and it's been moving in that direction. Broke out of the wedge briefly monday on a bonus unexpected surge from Amazon with rumors of a stock split. Tuesday and Wednesday was spent returning to channel bottom. Also Tuesday there was a rejection on the RSI which coincided with the pull back. RSI is now showing divergence if you draw a resistance line from January 25th high to it's most recent rejection on April 26th.
Short term, with Faang crushing earnings this thing should rocket tomorrow with no resistance channel wise for 180pts; RSI is a different story.
Long term, its looking like "Stay away may" unless Nasdaq can
A. Breakout of rising wedge
B. Break out of RSI divergence

Daily Market Update for 4/27Summary: The Nasdaq opened with a gap up but couldn't hold on, selling off briskly in the morning along with the other major indexes. Eventually positive consumer confidence numbers and continued growing demand outlook from OPEC helped the markets to settle down and end the day with a relatively small pull back overall.
Notes
Ideas always welcome in the comments. Errors will be amended as comments on TradingView or corrected inline in my blog.
-=x=-=x=-=x=-=x=-=x=-=x=-=x=-
Tuesday, April 27, 2021
Facts: -0.34%, Volume higher, Closing range: 24%, Body: 75%
Good: Higher high, higher low
Bad: Gap up at open, but couldn't hold on, distribution day on higher volume
Highs/Lows: Higher high, higher low
Candle: No upper wick, thick red body with a short lower wick
Advance/Decline: Two declining stocks for each advancing stock
Indexes: SPX (-0.02%), DJI (+0.01%), RUT (+0.14%), VIX (-0.45%)
Sectors: Energy (XLE +1.21%) and Industrials (XLI +0.83%) were top. Health (XLV -0.58%) and Utilities (XLU -0.77%) were bottom.
Expectation: Sideways
-=x=-=x=-=x=-=x=-=x=-=x=-=x=-
Market Overview
The Nasdaq opened with a gap up but couldn't hold on, selling off briskly in the morning along with the other major indexes. Eventually positive consumer confidence numbers and continued growing demand outlook from OPEC helped the markets to settle down and end the day with a relatively small pull back overall.
The Nasdaq closed with a -0.34% decline on higher volume. The distribution day resulted in a 75% red body that ended with a 25% closing range. A small lower wick was formed in the morning before the index found support above 14,000. The higher high and higher low continue an uptrend since last Wednesday. There were two declining stocks for every advancing stock.
The Russell 2000 (RUT) outperformed again with a +0.14% gain. The Dow Jones Industrial average (DJI) ended the day with a +0.01% gain. The S&P 500 (SPX) declined -0.02%.
The VIX volatility index declined -0.45%.
Only three sectors gained for the day. Energy (XLE +1.21%), Industrials (XLI +0.83%), Financials (XLF +0.79%) were the gainers. Health (XLV -0.58%) and Utilities (XLU -0.77%) were the biggest losers.
-=x=-=x=-=x=-=x=-=x=-=x=-=x=-
Economic Indicators
The US Dollar (DXY) had a small +0.05% gain.
The US 30y treasury bond and US 10y and 2y note yields all advanced for the day. The spread widened between the 10y and 2y note yields.
High Yield Corporate Bond (HYG) and Investment Grade Corporate Bond (LQD) prices both declined.
Silver (SILVER) advanced while Gold (GOLD) declined. Crude Oil (CRUDEOIL1!) advanced. Timber (WOOD) advanced. Copper (COPPER1!) advanced while Aluminum (ALI1!) declined.
-=x=-=x=-=x=-=x=-=x=-=x=-=x=-
Investor Sentiment
The put/call ratio dropped to 0.548. The put/call ratio (PCCE) is a contrarian indicator that shows overly bullish or overly bearish investor behavior. The 0.7 level is considered normal. As it approaches 0.60 (overly bullish) and below, watch for a possible pullback in the market.
The CNN Fear & Greed index remains just on the greed side of the neutral area.
-=x=-=x=-=x=-=x=-=x=-=x=-=x=-
Market Leaders
Microsoft (MSFT) and Amazon (AMZN) advanced with +0.16% and +0.25% gains. Apple (AAPL) and Alphabet (GOOGL) declined with -0.24% and -0.82% losses. Both Microsoft and Alphabet beat expectations on earnings reports after hours. Microsoft declined almost 4% in afterhours trading before gaining back some. Alphabet (GOOGL) gained over 4% in afterhours. The mixed reactions are result of the high expectations from investors. Microsoft had great results, but Alphabet absolutely smashed results. Alphabet also announced a stock buyback of $50 billion.
Alibaba (BABA), Exxon Mobile (XOM), Bank of America (BAC) and Oracle (ORCL) were a diverse mix of mega-caps to top the list for today. Tesla (TSLA) was at the bottom of the list with a -4.53% decline despite beating analyst expectations in their earnings report yesterday. Intel (INTC), Verizon (VZ) and PayPal (PYPL) round out the top four mega-caps.
Growth stocks were mixed for the day. Ehang Holdings (EH), RH (RH), Moderna (MRNA) and JD.com (JD) were the top gainers, all advancing over 3%. UP Fintech (TIGR), NIO (NIO) and Tesla (TSLA) were at the bottom of the list.
Investors reacted positively to AMD's (AMD) earnings report, sending the stock up 4%. Pinterest (PINS) warned about lower user growth after the pandemic and the stock slid over 10% in afterhours trading.
-=x=-=x=-=x=-=x=-=x=-=x=-=x=-
Looking ahead
Wednesday's news will include the Goods Trade Balance and Retail Inventories before market open. Crude Oil Inventories after the market open. There is a Fed Interest Rate Decision and FOMC Press Conference after 2pm. No changes are expected to monetary policy, but investors will watch closely the words and tone during the broadcast. President Biden is expected to announce his tax proposals in a speech after the market closes.
There may be some caution added to the market sentiment tomorrow based on the latter two news events.
Wednesday includes earnings reports from Apple (AAPL), Facebook (FB), Qualcomm (QCOM), Boeing (BA), Shopify (SHOP), ServiceNow (NOW), ADP (ADP), Spotify (SPOT), Ford (F), eBay (EBAY), and Teladoc (TDOC).
Be sure to check your portfolio for earnings reports so you are not surprised.
-=x=-=x=-=x=-=x=-=x=-=x=-=x=-
Trends, Support and Resistance
The index nearly made it to a new all-time high before dipping in the morning. It did hold key support areas.
The five-day trend line results in a +0.96% gain. The trend line from the 3/5 low, points to a +0.25% decline.
The one-day trend line shows a sideways trend to -0.08%, which may be reasonable if sentiment is cautious heading into the late day speeches by the Fed and President.
-=x=-=x=-=x=-=x=-=x=-=x=-=x=-
Wrap-up
It feels like the market is search for some direction based on earnings reports released so far this week. Tesla had great results, but investors are cautious about some of the headwinds in China and the safety issues in the US. Microsoft had record results but not quite enough to keep investors satisfied after hours. Alphabet and AMD were heartedly supported after their results. The reaction to other earnings reports such as Visa and Starbucks seem to be in line with the results.
Based on the candlestick chart, the higher high and higher low kept the Nasdaq in an uptrend, but the red candle and failed gap up provide some mixed signal. So the expectation is for sideways tomorrow and investors continue to cautiously watch earnings while also reacting to the tone from the Fed and any unexpected news from Biden.
Stay healthy and trade safe!

