Kraft Heinz weekly cup & handle !Kraft Heinz weekly cup & handle is made , NOW is time to buy for at least $70
KHC trade ideas


THE KRAFT HEINZ COMPANY (KHC) NASDAQ - Waiting for Entry PointTF: D
1. MACD Lines Entering Bottom
2. KC Price Drop Below Lower Line
3. MACD Histogram Bear Losing Power
4. Pullback
5. Impulse System Green or Hollow
6. All-Time High
7. Price Back to Blue Line/ Value Line (Entry Price)

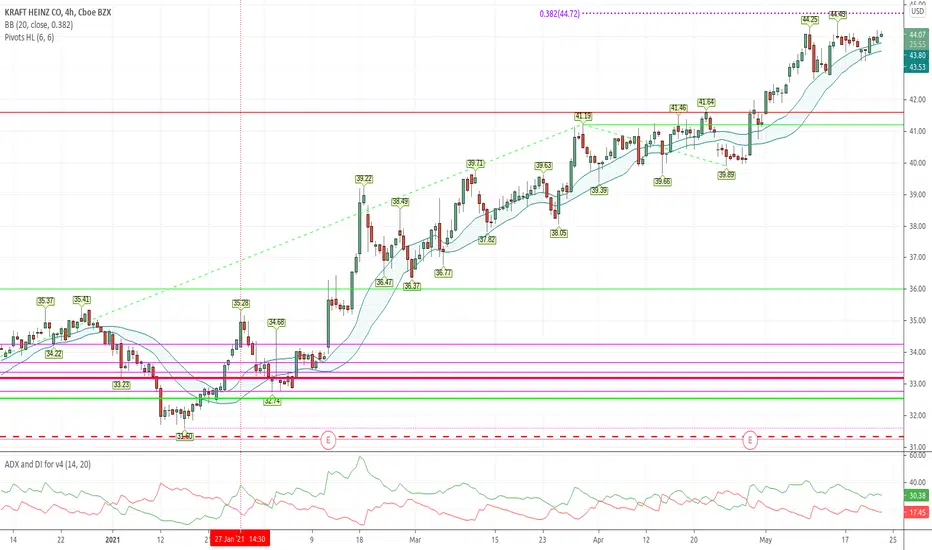
Kraft Heinz (KHC) approaches support level 42.56Kraft Heinz ($KHC) earlier corrected down to the golden support level 42.56, standing well outside of the lower daily Bollinger Band. Given the sharp uptrend – rated by Selected Alpha at the 79% level – which is also incorporating the sharp upward impulse from January (its strength is ranked at the 86.8% level) Kraft Heinz longs/short-term shorts will be reacting to the support level 42.56 – when Kraft Heinz ($KHC) approaches it – increasing the probability of the intraday upward reversal from this price level.

BreakoutWe have just exceeded the Bollinger Band and may expect a further rise to retest the high again.
Notice: The price could not correct downwards below the Band.
Bullish on KHC(This is not financial advice)
Quick consumer staples play here. I think tech will bleed a little bit this week at least for the early week. I think some of that money will rotate into recover and consumer staples which lagged last week. We are in a good uptrend here with KHC and hitting resistance but this could be a good chance to break through resistance here.
Thank you!
- Vlaire

KHC.NAS_Breakout Trade_LongENTRY: 39.97
SL: 28
TP1: 42
TP2: 48
- ADX>25
- RSI>65
- RS and FFI +ve
- Daily MACD just turned +ve
- Weekly MACD +ve
- MAs aligned
- Breakout with good volume on 26 Mar 2021

Is Kraft Heinz Worth The Squeeze. History says its time to dropI have changed up how to best display projected movement. In the case of KHC, 6 of my algorithms signaled a SELL on March 29, 2021. Equities nearly always obey the signal and move down, but sometimes it may continue to move up first.
I have placed two red boxes and two green boxes on the chart. The larger red box depicts all of the historical movement, from a percentage standpoint, that this stock has moved on the Hourly chart after a SELL signal occurred. Therefore, this box represents 100% of previous movement upward before the stock finally moved downward. The smaller red box represents 50% of all historical movement upward, before the stock moved downward. The smaller box is more of a precise target for the potential top in this instance.
The green boxes represent the same thing. In this instance, the smaller green box would be my projected target for the final bottom.
The black dotted arrow represents median historical movement. Medians are a good metric, but they are just one of many I use when forecasting future movement.
As always, the stock could decline the very next bar after the signal without looking back (therefore the red boxes would not come into play) or the stock may never decline (and the green boxes may never come into play).
All statistics and the full analysis are available for free as always at the site below.

Warren is holding strong, so am IKHC has been in a falling channel for 4 years. Then finally with a strong bounce off $20 it has broke through the channel.
At this point watch for the upwards weekly close over $35. There should be very little resistance to $44 and a break above that could send KHC into a bull run for the next several years.
There also could be a long period of accumulation. Warren Buffet has been criticized for becoming the largest shareholder in KHC. This may lead to selling off slowly as Berkshire reduce their holdings. Accumulation will be extended if this happens but in the end I see nothing but $ being made for long term holds.

Kraft showing a long swing of a 25% gain and R of 4Please follow the alphabetical callouts.
The trigger suggested by the white line.
the Payout ratio in the end calculating a return of 25%. I think this would take a 2-3 month hold. so perhaps one more round of dividend.


Bullish- Inverse head & shoulders Looking for a breakout at the $42.00 level and was bouncing off the 50day MA on the 5th: PT- $42.50
- Inverse Head & Shoulders on 1 month accompanied by a steady increase in volume as rotation into the sector as well as unusual Bullish option activity (Call Sweeps). Needs to break and hold above resistance

KHC: I want to be the ketchup kingEveryone will keep buying ketchup.
Inflation, deflation, stagflation whateflation.
Target 1: Fill the gap ($41+)
Right neckline complete to satisfy the completion of the H&S. Trade active at green.

$KHC breaking resistanceAfter trying to break the $36.15 line several times, it has now broke it and ready fill the gap at $48.85


Kraft Heinz - Buy setupKraft Heinz - Buy setup
If current projection holds, Kraft Heinz could see min. $40.32.
If we break below $35.29, the projection will be invalidated.
Give me a follow and I will post more charts.
Good luck and trade safe.


Kraft Heinz to 55 USD according to iHSDue to the inverted Head and Shoulders and respecting the Fibonacci Retracement levels we can expect KHC to go up to 55 USD.
TP Levels:
42 1st
55 2nd
68 3rd
Fundamentals aswell will give us a switch back to defensice stocks.
This is not an investment advice, just my own opinion.
