KURA Set for Liftoff: Breakthrough Cancer Drug, Massive Analyst Kura Oncology (KURA) is emerging from a prolonged downtrend just as its lead drug candidate, ziftomenib, approaches a critical FDA decision deadline this fall. With zeroed-in focus on targeted leukemia treatments and no approved competitors in its niche, Kura is positioned to benefit from increasing
Next report date
—
Report period
—
EPS estimate
—
Revenue estimate
—
−2.09 USD
−173.98 M USD
53.88 M USD
82.28 M
About Kura Oncology, Inc.
Sector
Industry
CEO
Troy E. Wilson
Website
Headquarters
San Diego
Founded
2014
FIGI
BBG008974342
Kura Oncology, Inc. operates as a clinical-stage biopharmaceutical company, which engages in the research and development of medicines for the treatment of cancer. Its pipeline includes Tipifarnib, which is a Farnesyl transferase inhibitor for HRAS Mutant Solid Tumors, Chronic Myelomonocytic Leukemia, KO-947, which is an ERK inhibitor for MAPK Pathway Tumors, and KO-539, which is a Menin MLL inhibitor for acute leukemias. The company was founded by Troy E. Wilson, Yi Liu, Pingda Ren and Antonio Gualberto on August 22, 2014 and is headquartered in San Diego, CA.
Related stocks

A Breakout Brewing or a Fading Flame? Boom or Bust Play!KURA is showing strong bullish momentum, recently forming a key gap at the $7.50 level, signaling growing interest from buyers. This gap-up suggests potential continuation to the upside, as the stock builds strength for its next move.
The key inflection point to watch is $9.49, a major weekly resis

KURA - falling wedgeOn this chart there is a falling wedge pattern.
The price is continuing to move inside the pattern.
We expect it to retest the trendline before bouncing up. Once it breaks out of the pattern it would be a good time to enter the long position.
Target and stop loss are shown on the chart.

KURANice breakout but volume was less than impressive. Will be watching over the next couple days/weeks to look for a possible trade setup.
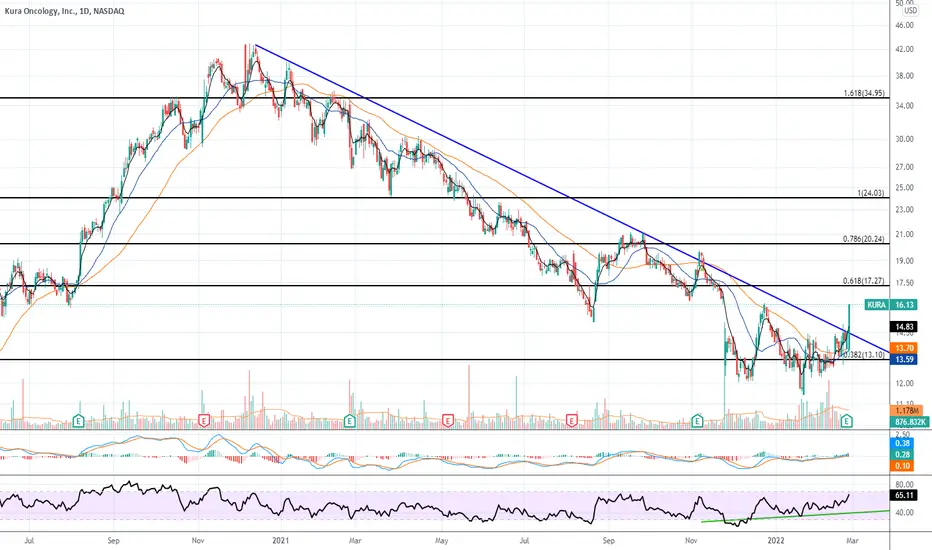

KURA Breakout The 9ema recently crossed the 20 ema and the most recent candle managed to close above the descending weekly trend line above the 50 SMA for just the 2nd time since January.
The RSI is still low and the MACD crossed just a few days ago. I think the price bottomed out on 8/20 and the recent price i

KURA - UPDATE - ON LONG TERM SUPPORT CONFLUENCEAll,
I think previouis post I had my lines slightly off which of course makes a difference I think we are on confluence support and beyond oversold/downtrend has to at least pop somewhat in my opiniong even if its $4-5. Looking for a bounce soon between weekly/daily change then getting 5-10 OTM opt

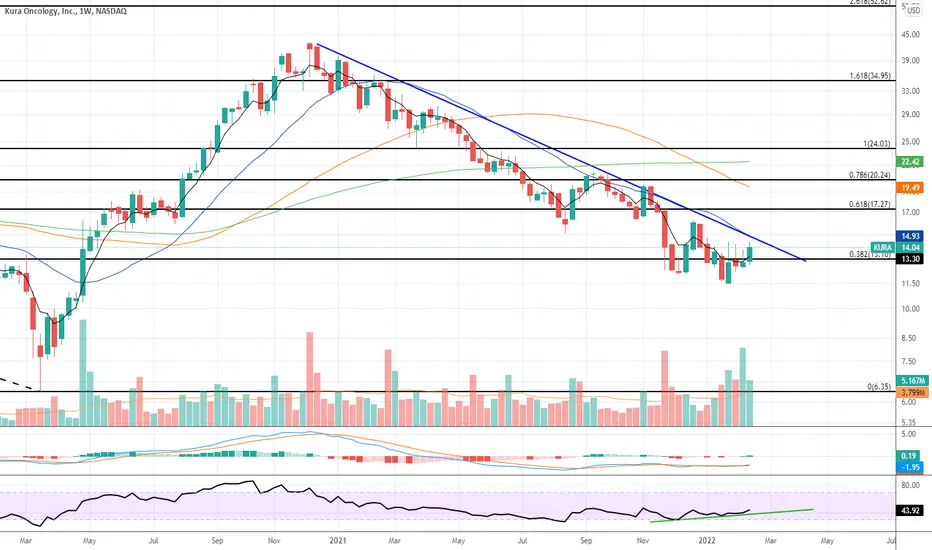
KURA - FALLING WEDGE HUGE PLAY HERE OPTIONS OR STOCK All,
I think this has a massive play possible here.
Why:
-Confleunce support (horizontally) + trend support
-Falling wedge downtrend
-40MA tight against trend (if you're a VWAP person I'm sure you would see a VWAP play)
-RSI/MACD both good
Recent news very positive. Looking into options Monday

Kura OncologyChart pattern: Bull flag
Entry: 32.40$ (this would end the downtrend of the correction)
Stop: 24$
Target: 60$
Stopmanagement: ATR Stops daily chart default settings
Risk:Reward-Ratio: > 3:1
Description: The chart is forming a bull flag with a nice corrective pattern. Target is the

See all ideas
Summarizing what the indicators are suggesting.
Neutral
SellBuy
Strong sellStrong buy
Strong sellSellNeutralBuyStrong buy
Neutral
SellBuy
Strong sellStrong buy
Strong sellSellNeutralBuyStrong buy
Neutral
SellBuy
Strong sellStrong buy
Strong sellSellNeutralBuyStrong buy
An aggregate view of professional's ratings.
Neutral
SellBuy
Strong sellStrong buy
Strong sellSellNeutralBuyStrong buy
Neutral
SellBuy
Strong sellStrong buy
Strong sellSellNeutralBuyStrong buy
Neutral
SellBuy
Strong sellStrong buy
Strong sellSellNeutralBuyStrong buy
Displays a symbol's price movements over previous years to identify recurring trends.
Curated watchlists where KURA is featured.

Mid-weight oncology stocks: The dark horses of cancer research
18 No. of Symbols
See all sparks
Frequently Asked Questions
The current price of KURA is 6.13 USD — it has decreased by −3.07% in the past 24 hours. Watch Kura Oncology, Inc. stock price performance more closely on the chart.
Depending on the exchange, the stock ticker may vary. For instance, on NASDAQ exchange Kura Oncology, Inc. stocks are traded under the ticker KURA.
KURA stock has risen by 7.98% compared to the previous week, the month change is a −6.32% fall, over the last year Kura Oncology, Inc. has showed a −72.94% decrease.
We've gathered analysts' opinions on Kura Oncology, Inc. future price: according to them, KURA price has a max estimate of 40.00 USD and a min estimate of 8.00 USD. Watch KURA chart and read a more detailed Kura Oncology, Inc. stock forecast: see what analysts think of Kura Oncology, Inc. and suggest that you do with its stocks.
KURA reached its all-time high on Dec 9, 2020 with the price of 43.00 USD, and its all-time low was 2.50 USD and was reached on Jul 5, 2016. View more price dynamics on KURA chart.
See other stocks reaching their highest and lowest prices.
See other stocks reaching their highest and lowest prices.
KURA stock is 5.76% volatile and has beta coefficient of 1.39. Track Kura Oncology, Inc. stock price on the chart and check out the list of the most volatile stocks — is Kura Oncology, Inc. there?
Yes, you can track Kura Oncology, Inc. financials in yearly and quarterly reports right on TradingView.
Kura Oncology, Inc. is going to release the next earnings report on Jul 31, 2025. Keep track of upcoming events with our Earnings Calendar.
KURA earnings for the last quarter are −0.66 USD per share, whereas the estimation was −0.60 USD resulting in a −10.01% surprise. The estimated earnings for the next quarter are −0.41 USD per share. See more details about Kura Oncology, Inc. earnings.
Kura Oncology, Inc. revenue for the last quarter amounts to 14.11 M USD, despite the estimated figure of 17.53 M USD. In the next quarter, revenue is expected to reach 39.11 M USD.
KURA net income for the last quarter is −57.43 M USD, while the quarter before that showed −19.22 M USD of net income which accounts for −198.84% change. Track more Kura Oncology, Inc. financial stats to get the full picture.
No, KURA doesn't pay any dividends to its shareholders. But don't worry, we've prepared a list of high-dividend stocks for you.
As of Jul 15, 2025, the company has 192 employees. See our rating of the largest employees — is Kura Oncology, Inc. on this list?
EBITDA measures a company's operating performance, its growth signifies an improvement in the efficiency of a company. Kura Oncology, Inc. EBITDA is −202.59 M USD, and current EBITDA margin is −356.97%. See more stats in Kura Oncology, Inc. financial statements.
Like other stocks, KURA shares are traded on stock exchanges, e.g. Nasdaq, Nyse, Euronext, and the easiest way to buy them is through an online stock broker. To do this, you need to open an account and follow a broker's procedures, then start trading. You can trade Kura Oncology, Inc. stock right from TradingView charts — choose your broker and connect to your account.
Investing in stocks requires a comprehensive research: you should carefully study all the available data, e.g. company's financials, related news, and its technical analysis. So Kura Oncology, Inc. technincal analysis shows the neutral today, and its 1 week rating is sell. Since market conditions are prone to changes, it's worth looking a bit further into the future — according to the 1 month rating Kura Oncology, Inc. stock shows the sell signal. See more of Kura Oncology, Inc. technicals for a more comprehensive analysis.
If you're still not sure, try looking for inspiration in our curated watchlists.
If you're still not sure, try looking for inspiration in our curated watchlists.