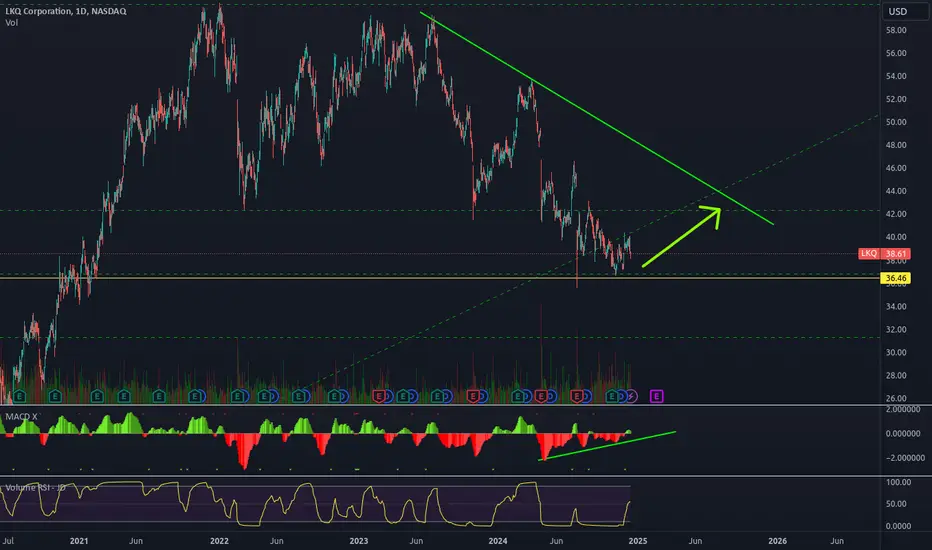
LKQ (Daily) upsideOnly insider buys between May and Dec 2024, combined with MACD bullish divergence and price testing support, suggest that the price may have some upside to test the daily trendline.
LKQ trade ideas

Bounce back into this channelProfit favours the brave. Short term upwards.
Looking to enjoy some gains. Before continuing to take a long term downtrend position

UpdatE: LKQ, Change Stop Loss=51(+12.45%)NASDAQ:LKQ
UpdatE: LKQ, Change Stop Loss=51(+12.45%).
Take Profit without change. Good luck everyone.


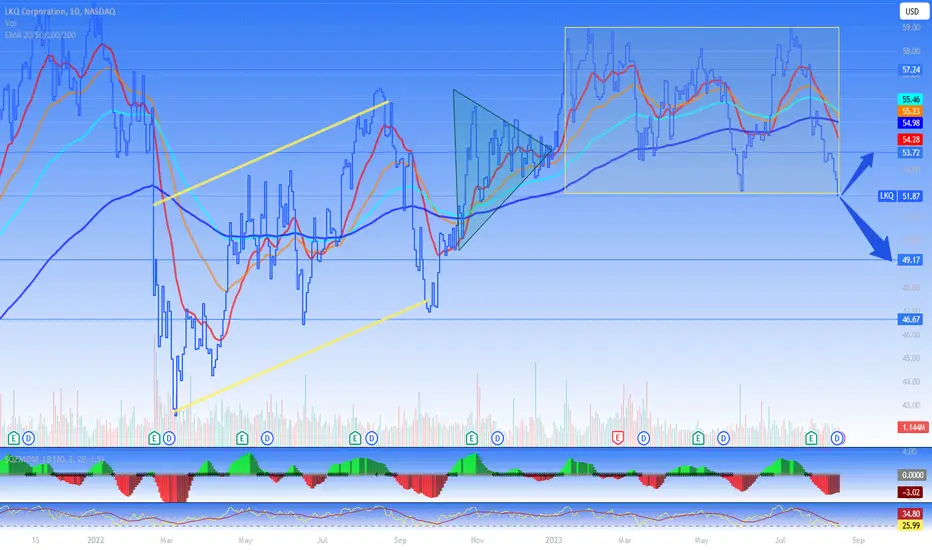
LKQ's fate to be decided today. LKQ was on an uptrend from March to October 2023. Nov-Dec 2022 was the period of consolidation. LKQ broke out in January 2023 but has been in a rectangular formation since. RSI is now nearly oversold. But the overall market is weak. Either ways, LKQ will come out of its rectangular formation today. If the market forces subdue it, a downtrend will start. Else a short uptrend reaching about 54.
LKQHello ladies and gentlemen, according to my chart analysis of the LKQ, there is a high probability of a decline towards the 46.24$ level in the next few weeks.

LKQ - Hidden Divergence - BullishOn the chart of LKQ, we can see a forming ascending triangle and we can see hidden bullish divergence on daily timeframe.
An ascending triangle is a bullish formation. The pattern gets validated when the price breaks out of the upside of the pattern.
By using the Relative Strength Index we can hidden bullish divergence.
A long position can be taken when the resistance of the triangle turns into a support.
See all further details on the chart.
Goodluck!

$LKQ with a Bullish outlook following its earnings #Stocks The PEAD projected a Bullish outlook for $LKQ after a Positive Under reaction following its earnings release placing the stock in drift A with an expected accuracy of 100%.

$LKQ with a Neutral outlook following its earnings #Stocks The PEAD projected a Neutral outlook for $LKQ after a Negative over reaction following its earnings release placing the stock in drift C with an expected accuracy of 57.14%.

LKQ: breakout watchLKQ is currently at a resistance point of a downtrend channel that started back in December 2021.
Watch for LKQ to break that trend line. A break would mark a potential reversal of the downtrend.
I'll be entering a long position on the break, with a stop at 49.50.
The ideal situation is if we break 51.60/51.70, then maybe we can fill the small gap at 53/53.50.
Next targets are 56.48 and 60.14.
Trade safe

$LKQ with a Neutral outlook following its earnings #Stocks The PEAD projected a Neutral outlook for $LKQ after a Positive over reaction following its earnings release placing the stock in drift B with an expected accuracy of 75%.

LKQ Corporation Announces $500 Million IncreaseLKQ: LKQ Corporation
2022-05-12 09:00:00
LKQ Corporation Announces $500 Million Increase in Stock Repurchase Program; total authorized now $2.5 Billion through October 2024


Is LKQ ready to break the Inverse Head and Shoulders pattern?With earnings coming up later this week, July 29th 2021, it's likely that LKQ may break and confirm the inverse head and shoulders pattern it has been forming since May of this year.
A daily break and close above $51.52 would confirm that the price wants to go higher and the target for this pattern would be around the $56.92 area.
Trade idea:
* Wait for a daily break and close above $51.52 before entering


SHORT | LKQNASDAQ:LKQ
Possible Scenario: SHORT
Evidence: Price Action
TP1~ 42.5
PUT options, Strike 42.5$, 05 /21/21
This is my idea and could be wrong 100%,

Short-Term Drop For LKQ?Five of our algorithms point to near-term declines for LKQ on the hourly chart. Our first algorithm (version 1) has identified this event 23 times. All 23 times the stock has dropped at least 1% over the next few days. It has dropped as much as 3% more than half the time. We are projecting slight movement up which should last no more than 2 full trading days before the decline could start. This is based on historical action of this stock when all 5 algorithms are signaled.

Cloud Pullback: LKQTrading the Ichimoku pullback to the cloud on NASDAQ:LKQ with March options aiming to get the move to retest the high going into Earnings in February.

Long | LKQNASDAQ:LKQ
Possible Scenario: LONG
Evidence: Price Action
This is my idea and could be wrong 100%
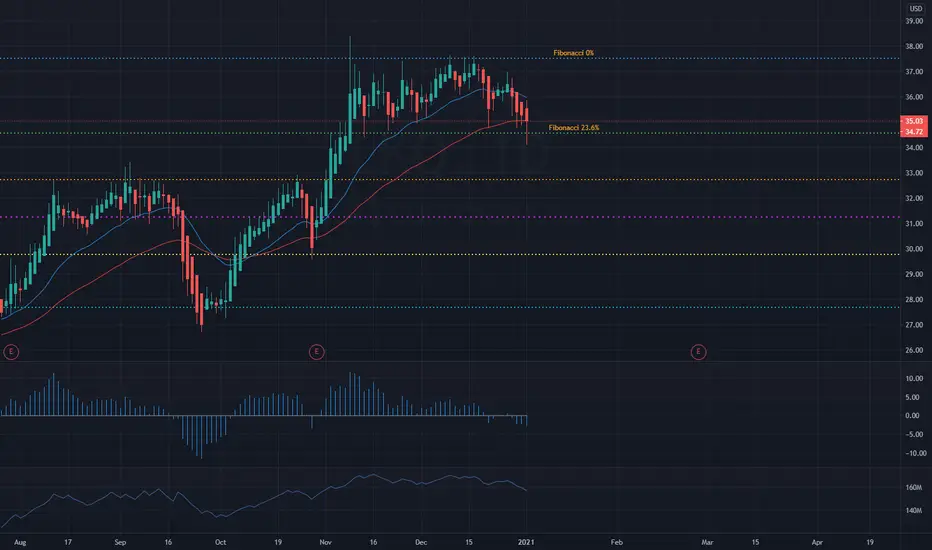

LKQ CORPORATION Plan DailyHey guys, LKQ CORPORATION is in an upward surge large buying volume especially in last session we can see a refusal of buyers. But on the TIMEFRAME below we are witnessing a reversal, it is very likely that it will rise to fill its bullish gap and reach the bottom of the next last higher. See even try to come and test the fibonacci to go down, following the high volume of purchases exchanged.
Please LIKE & FOLLOW, thank you!

3 Bar Play (Jared's) oPotential 3 Bar Play (Courtesy Jared). Big green igniting bar followed by a narrow range bar above the 50% retracement. If it hold above 27.90 today, good entry for long will be above 28.70 with SL as todays LOW (hopefully around 28 or 27.9) Target up to 30+
