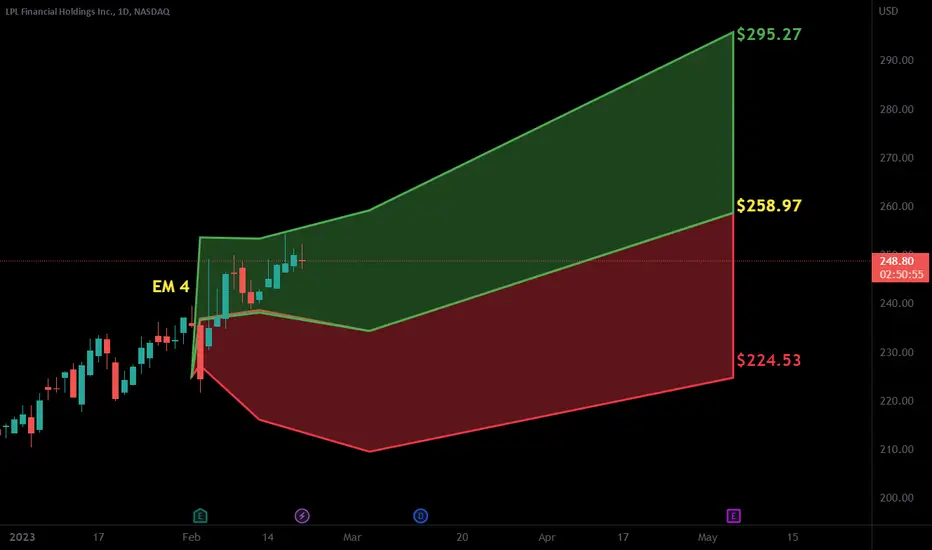
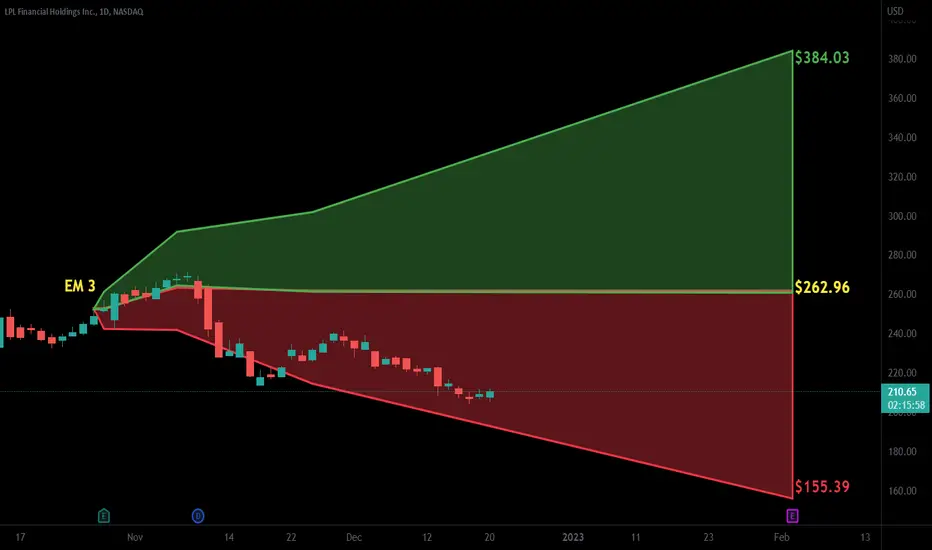
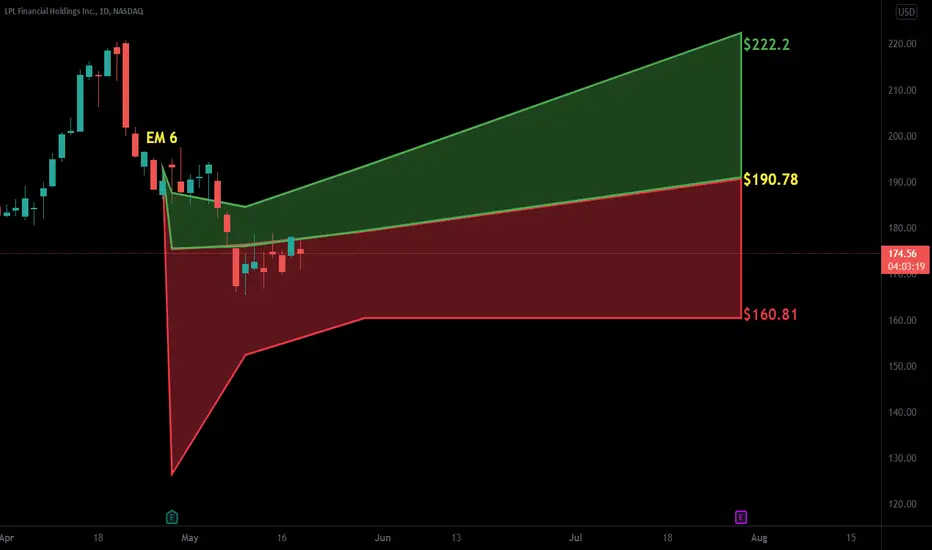
LPLA higher! LPLA just fired a daily squeeze (and is compressed in a squeeze on the weekly & monthly timeframes). Additionally, it's coming out of a head & shoulders pattern off the major bullish trendline. Key Fibonacci levels roughly align with the prior high at the 1.618 extension ($270-275) and the head &
Next report date
—
Report period
—
EPS estimate
—
Revenue estimate
—
14.72 USD
1.06 B USD
12.39 B USD
78.42 M
About LPL Financial Holdings Inc.
Sector
Industry
CEO
Richard Charles Steinmeier
Website
Headquarters
San Diego
Founded
1989
FIGI
BBG000P2TYL8
LPL Financial Holdings, Inc. serves the advisor-mediated marketplace as the nation’s independent broker-dealer and is an investment advisory firm and a custodian. It offers integrated technology solutions, brokerage & advisory platforms, clearing, compliance, business and planning and advice services, consultative practice management programs and training. The company provides personalized financial guidance to millions of American families seeking wealth management, retirement planning, financial planning and asset management solutions. LPL Financial Holdings was founded in 1989 and is headquartered in San Diego, CA.
Related stocks


$LPLA with a Bullish outlook following its earnings #Stocks The PEAD projected a bullish outlook for $LPLA after a positive under reaction following its earnings release placing the stock in drift A with an expected accuracy of 60%.
$LPLA with a Bullish outlook following its earnings #Stocks The PEAD projected a Bullish outlook for $LPLA after a Negative over reaction following its earnings release placing the stock in drift C with an expected accuracy of 66.67%.
$LPLA with a Bullish outlook following its earnings #Stocks The PEAD projected a Bullish outlook for $LPLA after a POsitive Under reaction following its earnings release placing the stock in drift A with an expected accuracy of 50%.

$LPLA with a Neutral outlook following its earnings #Stocks The PEAD projected a Neutral outlook for $LPLA after a Negative Under reaction following its earnings release placing the stock in drift D with an expected accuracy of 33.33%.

$LPLA - Cup & Handle BreakoutLPLA Analysis for potential C+H breakout.
Going long with January calls strike $185 looking for PT1: $200 PT2: $230
This could be a potential 1000% play.

Volatility Contraction Patterns Spotted in LPLA, COHR, COF Volatility contraction patterns (VCP) which was popularized by Mark Minervini have been spotted in NYSE:COF , NASDAQ:COHR and NASDAQ:LPLA , which could be the signal prior to a start of the uptrend.
Find out how to trade the breakout with volatility contraction patterns to catch the potential e

LPLA 3 Month #Cupandhandle #ChartPatternA clear resistance boundary around $85.80. A decisive daily close above that level will confirm the chart pattern and set the stage for a potential run to round number $100. Wait for breakout Confirmation for long entry.

See all ideas
Summarizing what the indicators are suggesting.
Neutral
SellBuy
Strong sellStrong buy
Strong sellSellNeutralBuyStrong buy
Neutral
SellBuy
Strong sellStrong buy
Strong sellSellNeutralBuyStrong buy
Neutral
SellBuy
Strong sellStrong buy
Strong sellSellNeutralBuyStrong buy
An aggregate view of professional's ratings.
Neutral
SellBuy
Strong sellStrong buy
Strong sellSellNeutralBuyStrong buy
Neutral
SellBuy
Strong sellStrong buy
Strong sellSellNeutralBuyStrong buy
Neutral
SellBuy
Strong sellStrong buy
Strong sellSellNeutralBuyStrong buy
Displays a symbol's price movements over previous years to identify recurring trends.
LPHI6044833
LPL Holdings, Inc. 5.75% 15-JUN-2035Yield to maturity
5.45%
Maturity date
Jun 15, 2035
LPHI6013888
LPL Holdings, Inc. 5.65% 15-MAR-2035Yield to maturity
5.45%
Maturity date
Mar 15, 2035
LPHI5182917
LPL Holdings, Inc. 4.375% 15-MAY-2031Yield to maturity
5.34%
Maturity date
May 15, 2031
LPHI5811532
LPL Holdings, Inc. 6.0% 20-MAY-2034Yield to maturity
5.30%
Maturity date
May 20, 2034
LPHI5144117
LPL Holdings, Inc. 4.0% 15-MAR-2029Yield to maturity
5.08%
Maturity date
Mar 15, 2029
LPHI6044831
LPL Holdings, Inc. 5.15% 15-JUN-2030Yield to maturity
4.74%
Maturity date
Jun 15, 2030
LPHI6013887
LPL Holdings, Inc. 5.2% 15-MAR-2030Yield to maturity
4.69%
Maturity date
Mar 15, 2030
LPHI5811531
LPL Holdings, Inc. 5.7% 20-MAY-2027Yield to maturity
4.56%
Maturity date
May 20, 2027
LPHI6044832
LPL Holdings, Inc. 4.9% 03-APR-2028Yield to maturity
4.44%
Maturity date
Apr 3, 2028
LPHI4910572
LPL Holdings, Inc. 4.625% 15-NOV-2027Yield to maturity
4.38%
Maturity date
Nov 15, 2027
LPHI5700771
LPL Holdings, Inc. 6.75% 17-NOV-2028Yield to maturity
4.31%
Maturity date
Nov 17, 2028
See all LPLA bonds
Frequently Asked Questions
The current price of LPLA is 368.85 USD — it has decreased by −2.61% in the past 24 hours. Watch LPL Financial Holdings Inc. stock price performance more closely on the chart.
Depending on the exchange, the stock ticker may vary. For instance, on NASDAQ exchange LPL Financial Holdings Inc. stocks are traded under the ticker LPLA.
LPLA stock has fallen by −7.79% compared to the previous week, the month change is a −3.01% fall, over the last year LPL Financial Holdings Inc. has showed a 90.06% increase.
We've gathered analysts' opinions on LPL Financial Holdings Inc. future price: according to them, LPLA price has a max estimate of 492.00 USD and a min estimate of 400.00 USD. Watch LPLA chart and read a more detailed LPL Financial Holdings Inc. stock forecast: see what analysts think of LPL Financial Holdings Inc. and suggest that you do with its stocks.
LPLA reached its all-time high on Jul 31, 2025 with the price of 403.58 USD, and its all-time low was 15.38 USD and was reached on Feb 12, 2016. View more price dynamics on LPLA chart.
See other stocks reaching their highest and lowest prices.
See other stocks reaching their highest and lowest prices.
LPLA stock is 4.07% volatile and has beta coefficient of 1.34. Track LPL Financial Holdings Inc. stock price on the chart and check out the list of the most volatile stocks — is LPL Financial Holdings Inc. there?
Today LPL Financial Holdings Inc. has the market capitalization of 30.30 B, it has decreased by −3.12% over the last week.
Yes, you can track LPL Financial Holdings Inc. financials in yearly and quarterly reports right on TradingView.
LPL Financial Holdings Inc. is going to release the next earnings report on Oct 23, 2025. Keep track of upcoming events with our Earnings Calendar.
LPLA earnings for the last quarter are 4.51 USD per share, whereas the estimation was 4.23 USD resulting in a 6.71% surprise. The estimated earnings for the next quarter are 4.67 USD per share. See more details about LPL Financial Holdings Inc. earnings.
LPL Financial Holdings Inc. revenue for the last quarter amounts to 3.84 B USD, despite the estimated figure of 3.77 B USD. In the next quarter, revenue is expected to reach 4.12 B USD.
LPLA net income for the last quarter is 273.25 M USD, while the quarter before that showed 318.57 M USD of net income which accounts for −14.23% change. Track more LPL Financial Holdings Inc. financial stats to get the full picture.
Yes, LPLA dividends are paid quarterly. The last dividend per share was 0.30 USD. As of today, Dividend Yield (TTM)% is 0.32%. Tracking LPL Financial Holdings Inc. dividends might help you take more informed decisions.
LPL Financial Holdings Inc. dividend yield was 0.37% in 2024, and payout ratio reached 8.55%. The year before the numbers were 0.53% and 8.76% correspondingly. See high-dividend stocks and find more opportunities for your portfolio.
As of Aug 8, 2025, the company has 9 K employees. See our rating of the largest employees — is LPL Financial Holdings Inc. on this list?
EBITDA measures a company's operating performance, its growth signifies an improvement in the efficiency of a company. LPL Financial Holdings Inc. EBITDA is 2.52 B USD, and current EBITDA margin is 17.90%. See more stats in LPL Financial Holdings Inc. financial statements.
Like other stocks, LPLA shares are traded on stock exchanges, e.g. Nasdaq, Nyse, Euronext, and the easiest way to buy them is through an online stock broker. To do this, you need to open an account and follow a broker's procedures, then start trading. You can trade LPL Financial Holdings Inc. stock right from TradingView charts — choose your broker and connect to your account.
Investing in stocks requires a comprehensive research: you should carefully study all the available data, e.g. company's financials, related news, and its technical analysis. So LPL Financial Holdings Inc. technincal analysis shows the sell today, and its 1 week rating is buy. Since market conditions are prone to changes, it's worth looking a bit further into the future — according to the 1 month rating LPL Financial Holdings Inc. stock shows the buy signal. See more of LPL Financial Holdings Inc. technicals for a more comprehensive analysis.
If you're still not sure, try looking for inspiration in our curated watchlists.
If you're still not sure, try looking for inspiration in our curated watchlists.