LYFT Stock Chart Fibonacci Analysis 041723 Trading Idea
1) Find a FIBO slingshot
2) Check FIBO 61.80% level
3) Entry Point > 9.95/61.80%
LYFT trade ideas
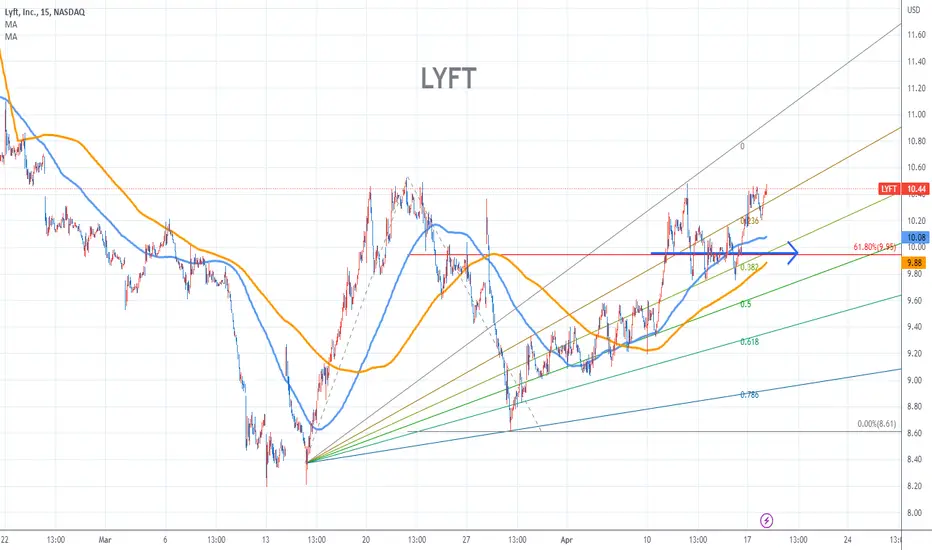
LYFTAdded BJ Key Levels to this NASDAQ:LYFT chart, along with 20/50/100/200 EMA's.
1) Above the 20 EMA
2) Breaking a respected down trend
3) Approaching the Point Of Control on the Daily time frame.
I will be looking for a entry if price breaks above the next important EMA (50 in this case) with an increase of volume. If an entry is taken above the 50ema I will extremely cautious until we get conformation above the POC. My entry will most likely be a break above 10.57 with a warning of the level of 10.92 , If we push past that its a Blue Sky Breakout IMO.
The safest trade here would be waiting for $12.65 then riding it to the 200EMA.

LYFT me up, please! Where do you go from here?
Fib circles say we might get a nice curl up to the 16.00 range. I don't live in a area where ride sharing is a popular means of travel so I don't know what this company is doing right / wrong. Id like to dig into to LYFT and see if they are making any changes to increase use, and ultimately increasing the stock price. Love to colab with someone on a stock digging into financials and seeing what's on the horizon for a company. Lets put a play together!

LYFT, lyfting off soon....DAILY chart suggests a clear shifting price movement..
on Weekly, a divergence line is also happening.
Spotted at 9.27
Initial target is 15.00
SL at 8
TAYOR.

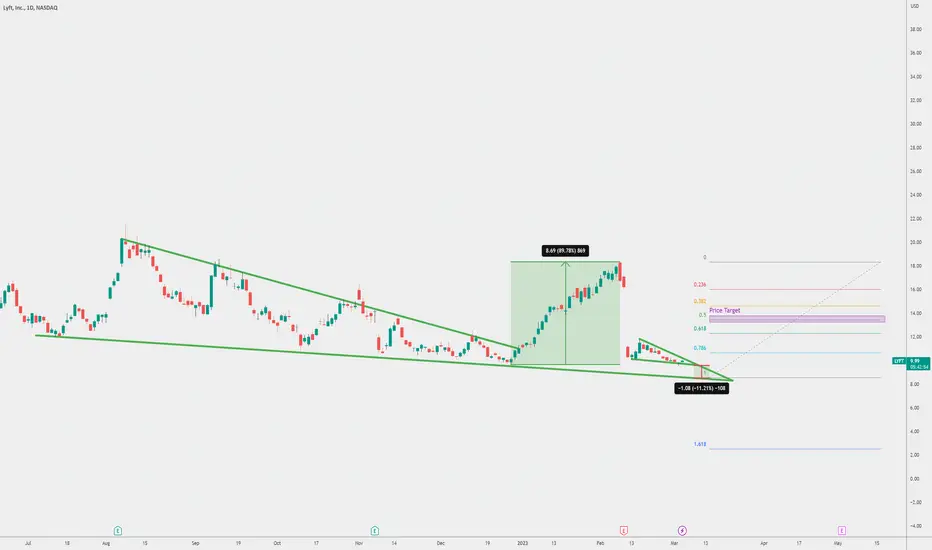
LYFT - Buy the Dip, Ride the LiftAccording to the Internet, Lyft is down some 30% post-market following an earnings call that says the company slightly beat revenue and active rider targets, but reduced guidance for Q1 '23 by roughly 10%.
Q1 spending and travel being down under the conditions of a) post-Christmas and b) in an economy where credit card debt and credit card rates are climbing high count as a surprise to absolutely nobody.
This kind of situation immediately piques my interest. It piques it because the move smells of big money manipulation, the #1 sign that something is about to reverse and a big move is pending.
But the news only caught my interest because a Twitter friend had DM'd me about a trendline astrology breakout on Lyft last month, otherwise I had never looked at it, and so I have had it in the back of my head all this time that a pullback to the trendline would actually be worth looking at buying.
Now that I've actually looked at Lyft, I like what I see.
There's a smaller precedential fractal on Silver futures that illustrates the kind of play I've been looking to see manifest.
Trendline breakout --> retest --> more up is a very common pattern that MMs like to play.
China Watch
The markets are shaky right now, as is the rest of the world. The reason is, the Wuhan Pneumonia pandemic situation in mainland China is countless times worse than the media and Xi Jinping and his Chinese Communist Party are telling the world. The regime still claims that under 100,000 people have died from COVID over the last three years.
Just go take a look at how many people have died from COVID in countries with 5-30% less population, countries that aren't the origin of the pandemic, and ask yourself if there's even a 0.001% chance that the CCP isn't just lying and covering up the situation because the Party is _highly_ unstable right now.
If you still don't believe it, then remember the Party covered up the 2003 SARS epidemic too. A lot of people died, but the communist regime has always claimed only a few thousand died.
It's almost like an evil communist dictatorship has to lie a lot to keep its political power in tact, or something.
It's almost like evil communism doesn't lift anyone out of poverty and isn't saving any lives, or something.
What a revelation.
Regardless, the CCP will fall in our lifetimes, much like the USSR fell on Boxing Day '91. When the Party goes, a lot of things are going to go with it, because China is a much bigger deal than Russia. This is humanity's oldest country, self described as the ("Middle Kingdom"), and the only country to have roots to a 5,000 year old traditional, divine culture.
It's also the only country where its government has gone so far as to commit the unprecedented crime of live organ harvesting during the persecution of Falun Gong and Uyghur Muslims, and is composed of the most wicked and shameless rogues, and is the most heinous mafia, in all of human history.
When the Party falls, a lot of governments are going to try to take China. And on top of that, what comes out of China as, and after, the Party falls, will implicate many of the same governments and the corporations they formed these "public-private partnerships" with.
A lot of individuals will also be implicated. The Sam Bankman-Fried scandal will seem rather insignificant (although you'll also see what was really behind that).
All of this combines to mean that any bull market can be sharply and immediately truncated by both geopolitical and natural disaster risks. You have to bear this in mind and take profits on the way up if you're lucky enough to get a winning position!
The trade
On the monthly bars, LYFT isn't really amazing at first glance. I, mean, it could go to $0 right? Everyone knows everything is going to zero because FEDERAL RESERVE and because RECESSION and because ECONOMY.
This is the problem with the bear narrative right now. Instead, you should be looking for bull impulses inside of the prevailingly bearish fundamentals.
But then I looked at the weekly and I saw what needed to be seen.
Namely, the last 6-8 months of trading have been a play on the '20 low of $14.56.
More over, this earnings dump was arranged with a failure to break the $18.58 September '22 high, which has created a double top
To me, this, combined with the fact that tech should really be the next thing to pump in anticipation of a July --> December genuine bearpocalypse, leads me to believe Lyft actually bottomed in December.
All and all, the play is simple:
1. Buy under $12
1. a) Don't get scared
2. Don't want to see a new low set
3. Targets are the $18.58 double top, May '22 $22.82 gap candle, and the $30 gap fill.
What's not to like on the risk/reward in this trade for a company that isn't about to head towards bankruptcy?
Moreover, it's not like we're about to see another round of pandemic lockdowns in the next three months, so travel demand ought be hot going into the summer.
Moreover, I joked in my Intel short-long-short call from last week that the most profitable trade in the US equity markets has to be buying the dip after an earnings dump and waiting for the gap fill/gamma squeeze to play out lol.
Intel Corporation - Buy the Raid, Ride the Wave
Good luck, stay safe, and choose a future for yourselves by opposing the CCP and all of its Marxist-Leninist garbage.

$lyftLyft looking for a uber ride to the top soon? Rough ER, Basing into resistance- if fails I can see a foreseeable 11% dip, but soon to the upside in a relatively short amount of time for call prints
LYFT CHART Broke the trend line Please see the chart and what we learn today as it broke the trend line yesterday with bearish candle and today again with bearish candle , this clearly indicates that after market news might be bearish and it revenue didn’t came as expected and stock down all the way to 11$ range . Please share the idea if you like the analysis.

LYFT earnings reaction into the 76. Another big talking point of the day is the LYFT move.
As usual, when a trade becomes a popular topic of conversation, I like to see if we're into one of the big fib levels for a fade.
This move is right into the 76. May be a low.
Tight stops. We should make a clean low if this is working.

LYFT SWING TRADE IDEAAfter news came out about their new initiative to give people on the way to a job interview a free ride, my eyes have been on LYFT. I immediately took note of their fundamentals.. whew! In its history, its only missed earnings twice! In my opinion, LYFT has longevity potential!
With earnings coming up next Thursday, I love the position this stock is sitting in right now! It has come to meet a major supply zone and the primary trend line, around 17.45. A break and retest of this zone and I will look to take it up towards 20.50. If we reject this supply zone and trend line, I will look to take it down towards 13.85

LYFT could see a possible riseSupport has developed, if the price breaks above $12.05 we could see a rise to $15.6 or possibly $20

Getting tighter!Check my previous post about Lyft. Price is getting tighter in the falling wedge and at the same time we have a bullish divergence. Looks like it wants to erupt like a volcano.

Did it bottom?Top chart weekly, bottom chart monthly. See the pattern? The monthly timeframe shows the price has been trading in oversold territory for 5 months, last time that happened the price blew up. I'm opening a small long position on Monday if a see the price trying to break the resistance I'll add.

$LYFT BREAK OUT! LFYT potential to see a break out and ride back to the massive gap down. Currently trading under COVID LOWS

$LYFT Long Entry is Possible 🚗This trade could be risky for short term trading as the price is still making lows. However, if you are looking to hold for 3-4 months, then a small entry here can be beneficial. Today I added like 2.5% of my portfolio. Let's see.

Might be forming wave B ending this diagonalI'm feeling like we are ending a diagonal wave and the latest wave formation is a flat (3,3,5). Thus I'm seeing if something like this could play out but we'll see what happens. So pop up to finish wave B, then 5 fractals down.
Thoughts, anyone?
*Not financial advice, just my ideas.

Lyft Being Accumulated?At a commenter's request: Lyft has some interesting patterns. It's currently in a bearish channel established at its inception. Given the state of the economy, I wonder if someone isn't accumulating it while they wait for things to "get back to normal." Drag it down, get it cheap, then wait for it come roaring back.

Buy 9 shares of LYFT foe Every one share of XLULyft
SPDR Select Sector Fund
---
1- No stop loss.
-
2- for options is Excellent:
5 call option 3 months contract of SPDR Select Sector Fund for every One call option 3 months contrac of Lyft .
----
Happy Trading!

Lyft May Have a Descending TriangleRidesharing company Lyft has tried to hold a price range since the spring. Now, after a couple of fleeting bounces, a bearish continuation pattern could be materializing.
Notice the high on August 8 near $20, followed by a pullback to $13.75. LYFT then bounced but couldn’t get above $19. That high and lower high have produced a descending triangle -- a potentially bearish continuation pattern.
The stock has tried to hold the bottom of the formation this week and could now be at risk of breaking below it.
Next, you have the 100-day simple moving average (SMA), which has tracked neatly along the top of the triangle. Prices have also slipped back under the 50-day SMA.
Finally, MACD is turning bearish.
TradeStation has, for decades, advanced the trading industry, providing access to stocks, options, futures and cryptocurrencies. See our Overview for more.
Important Information
TradeStation Securities, Inc., TradeStation Crypto, Inc., and TradeStation Technologies, Inc. are each wholly owned subsidiaries of TradeStation Group, Inc., all operating, and providing products and services, under the TradeStation brand and trademark. You Can Trade, Inc. is also a wholly owned subsidiary of TradeStation Group, Inc., operating under its own brand and trademarks. TradeStation Crypto, Inc. offers to self-directed investors and traders cryptocurrency brokerage services. It is neither licensed with the SEC or the CFTC nor is it a Member of NFA. When applying for, or purchasing, accounts, subscriptions, products, and services, it is important that you know which company you will be dealing with. Please click here for further important information explaining what this means.
This content is for informational and educational purposes only. This is not a recommendation regarding any investment or investment strategy. Any opinions expressed herein are those of the author and do not represent the views or opinions of TradeStation or any of its affiliates.
Investing involves risks. Past performance, whether actual or indicated by historical tests of strategies, is no guarantee of future performance or success. There is a possibility that you may sustain a loss equal to or greater than your entire investment regardless of which asset class you trade (equities, options, futures, or digital assets); therefore, you should not invest or risk money that you cannot afford to lose. Before trading any asset class, first read the relevant risk disclosure statements on the Important Documents page, found here: www.tradestation.com .

Lyft inc Fib TriangleWaiting for better times for a long-term entry. Sub-35 is my desired price level to kick off the strategic accumulation of the stock.
Credible alternative to UBER.

LYFT: Uplift due?LYFT Inc
Intraday - We look to Buy at 12.19 (stop at 8.59)
Daily signals for sentiment are at oversold extremes. Prices expected to stall near trend line support. We expect a reversal in this move. Dip buying offers good risk/reward. A higher correction is expected.
Our profit targets will be 22.86 and 29.00
Resistance: 23.00 / 45.00 / 66.00
Support: 12.00 / 6.00 / 3.00
Please be advised that the information presented on TradingView is provided to Vantage (‘Vantage Global Limited’, ‘we’) by a third-party provider (‘Signal Centre’). Please be reminded that you are solely responsible for the trading decisions on your account. There is a very high degree of risk involved in trading. Any information and/or content is intended entirely for research, educational and informational purposes only and does not constitute investment or consultation advice or investment strategy. The information is not tailored to the investment needs of any specific person and therefore does not involve a consideration of any of the investment objectives, financial situation or needs of any viewer that may receive it. Kindly also note that past performance is not a reliable indicator of future results. Actual results may differ materially from those anticipated in forward-looking or past performance statements. We assume no liability as to the accuracy or completeness of any of the information and/or content provided herein and the Company cannot be held responsible for any omission, mistake nor for any loss or damage including without limitation to any loss of profit which may arise from reliance on any information supplied by Signal Centre.


LYFT - Short Position Reviewing a short position I just opened. Entered at 16.51$ as LYFT was approaching the highlighted resistance level and above 70 on the RSI, indicating that it is overbought. I'll be adding shares once I get confirmation of the move to the downside I'm looking for. Simple trade, limited risk as it is not too volatile and I have no problem with holding this over the weekend. Good luck everyone.
