$LYFT Double Bottom Cheat SetupIts been over 2 weeks since I posted about the weekly double bottom on $LYFT. My comment was "I'll be watching the daily for a cheat of some sort".
Seems like we might be setting up a cheat area on daily. Watching closely this week.
LYFT trade ideas

LyftScary markets. I put order in at 52.93 I was filled. This is suppor of rising channel. I like it up to 59$. As long as we hold above 52.50 we should bounce when markets cool off. Be careful but seems solid

Don't Give Up SoonTook profits at $60 once it reached the fib level The bears couldn't create a strong pullback thereafter, so LYFT still looking strong imo. Current price level is still attractive.
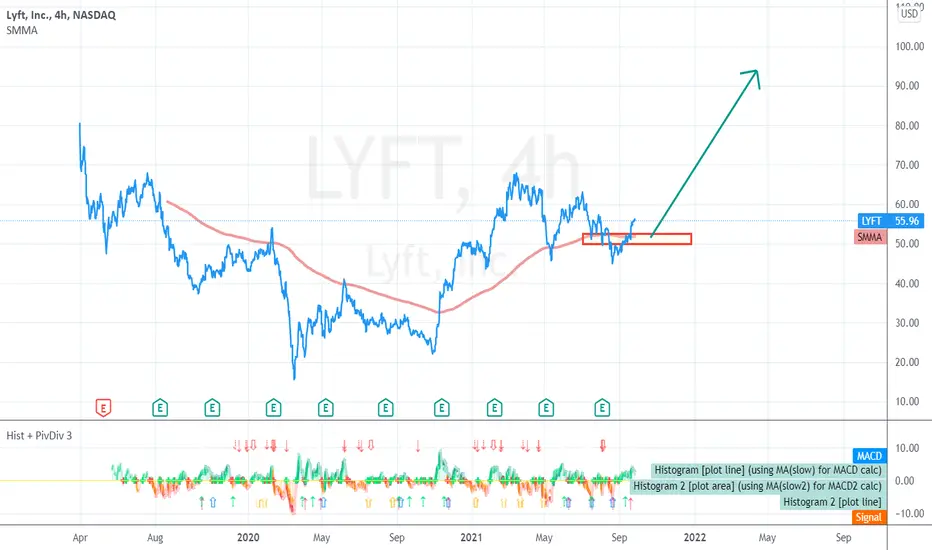
$LYFT Weekly Double Bottom (Early still)I think this weekly double bottom on $LYFT has potential. I'll be watching the daily for a cheat of some sort. None setting up at the moment, but really liking the potential on this weekly setup.

$LYFT Chart Analysis going into tomorrowPURELY EDUCATION AND ENTERTAINING MATERIAL
Personal use:
$LYFT looks prepped for a breakout. Calls can be played on a break of two major pivots.
First one is claiming the .618% fib level at 55.81 using 5 min. The greater of the two being the pivot at previous HOD @ 56.14.
A 5 or 15min candle close above the levels is bullish (short term). BUT a 15min candle close above these pivot point brings a high chance we visit the .786% fib level @ 59.00. Additionally, we have the volume gap to fill represented by the yellow-tinted rectangle.
A breakdown of the previous LOD @ 54.81 can be used to scalp put options.

LYFT, Inc. SHORT POSITIONLyft Inc. is an on-demand transportation-as-a-service provider. The company is the second-largest ride-sharing service provider in the U.S., connecting riders and drivers over the Lyft app that has also entered the bike- and scooter-share market to bring multimodal transportation options to users.
Daily RSI is still bullish but we can spot a bearish divergence, pointing at a possible pullback and re-test of previous supports. In fact, on 4 hours time frame, we can see how the prices already hit the upper level of the Keltner Channel and is now re-tracing, with a decreasing RSI. Using the Williams Fractals, we can see the bullish fractal already appeared. Due to these findings, all indicators are going at the bearish momentum, therefore a short signal is generated.
Position: SHORT
Entry price: $ 52.05
Target price: $ 44.76
NO FINANCIAL ADVICE


WATCHING $LYFT Analysis & Key LevelsWATCHING $LYFT Analysis & Key Levels
This looks like it might be setting up for a nice swing…
Red = Resistance
Green = Support
Blue = trend lines
180 EMA = Purple
I am not your financial advisor. Anything can happen… I’m just posting what I see… but the risk is on you if you decide to trade the setup with me.
I certainly don’t win them all so be mindful of your position sizes and do your due diligence. I’m happy to answer questions to the best of my ability.
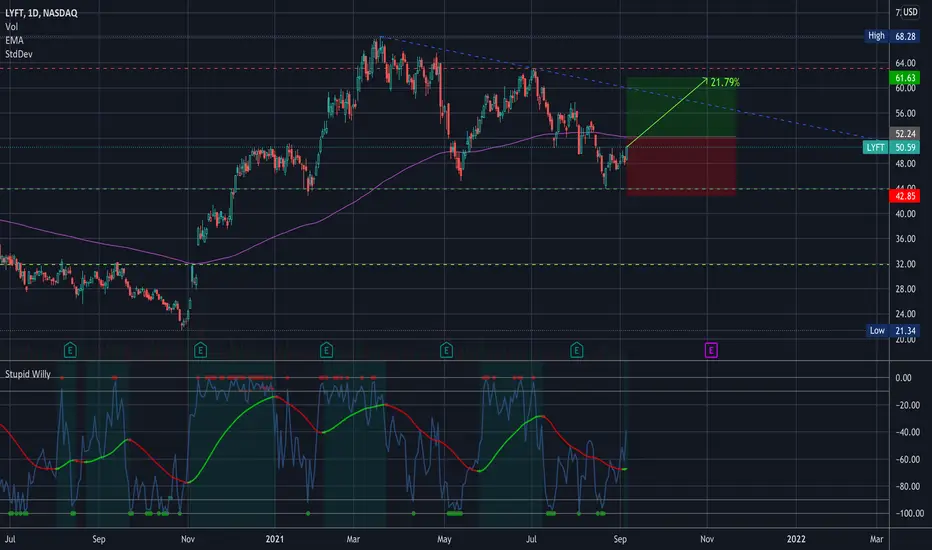
LYFT⬆ BULLISH
MktCap $16.16B
Price $49.86
Price target $57.75/ 66.20
Stop loss $46.96
In my opinion.

#Lyft = New High with a great RSI Buy for the weekDouble Low on the Daily + Great EMA Crossover + Historical FIBB = New High and $$$$$$$$$$$$$$

LYFT EMA PullbackLYFT has bounced off support at the 46 level and ran up back to its 13 EMA, where today it has been rejected on a red candle. This looks like to reestablish more downside back to the 46 support

TrendyTrades: Bullish LYFT AnalysisLooking for a close above 54.80. If we can close above, it can serve as confirmation.
PT.1: 58
PT.2: 60

LYFT: Potential shortUpsloping H&S pattern.
Weak rebound from neckline.
Possible area to start shorting at $58-$59.50
Target profit 1 area at neckline/ up trendline i.e around $52.50-$52
Target profit 2 area at next support around $48.50-$50
Disclaimer: I'm not giving any trading and investing advice. I'm just sharing my chart observations.
If you have any symbols that you'd like me to analyze, feel free to drop me a comment.

LYFT - Ascending Channel or a Bearish Flag?LYFT is a very good software stock. From the technical perspective, the possibilities are very high for both of the scenarios "Ascending Channel" Or "Bearish Flag". Today after the market closes this company will release earnings. Seen that we are in a very strong bullish trend and the earnings of the company have been above expectations during the previous quarters the chances are very high for a bullish movement.
If the price will move down below $53.85 we may see the development of the bearish scenario.
Thank you and Good Luck!

LYFTThere are 2 options for an even more complex correction, which will continue and 1 option for growth, so we are waiting for a breakdown and consolidation of the blue level, if we are considering a long one. Short, respectively, at the breakdown of 0.618 fibo


Bull flag but I want to be short... Looking like its about to break out.
Still bearish but starting to second guess with this set up.

LYFT FlagLYFT has been consolidating between the 55-59 range, it is looking more and more bullish as it is now testing 59 for the 4th time. A breakout of this flag could drive price to the top of range around 63-64

Keep an eye on this pivot point! 👁 👍Lyft is doing a nice pullback right now, in the 30min chart. The 20 is pretty close, but since the BB are so spread open, I believe it’ll move sideways for some time.
The 60.26 is a pivot, and if Lyft breaks it, it’ll do something good.
The problem is the RSI in the 4h chart, showing a bearish divergence + false breakout from the top area at 59s. This is another indicator that Lyft is not ready yet, but it can be in the future. It is one of the stocks that are on my radar, but it is not doing anything impressive for now.
Let’s watch the pivot in the 30min chart closely!
If you liked this trading idea, remember to click on the “Follow” button to get more trading ideas like this, and if you agree with me, click on the “Agree” button 😉.
See you soon,
Melissa.
