MAPS "Strong BUY"WestPark Capital has reiterated a "Strong Buy" rating with a price target of $2.61, suggesting a potential upside of over 100% from the current price . Similarly, other analysts have set price targets ranging from $2.64 to $2.74, indicating an average upside of approximately 106%
Next report date
—
Report period
—
EPS estimate
—
Revenue estimate
—
0.0876 USD
7.64 M USD
184.51 M USD
80.40 M
About WM Technology, Inc.
Sector
Industry
CEO
Doug Francis
Website
Headquarters
Irvine
Founded
2008
FIGI
BBG00PT7WC50
WM Technology, Inc. operates as an online cannabis marketplace. Its products include Weedmaps and Weedmaps for Business. It provides cannabis consumers with information regarding cannabis retailers and brands. The company was founded by Douglas Francis and Justin Hartfield in 2008 and is headquartered in Irvine, CA.
Related stocks

WM Technology | MAPS | Long at $1.00WM Technology NASDAQ:MAPS provides ecommerce and compliance software solutions to retailers and brands in cannabis market in the United States and internationally. After it's de-SPAC in 2020, it soared to $29.50 and now can be found for around $1.00. It's been consolidating at these lows for almos

Need a high? WM Technology inc for 500% returnOn the above 5 day chart price action has corrected over 95% since early 2021. A number of reasons now exist for a bullish outlook, they include:
1) Price action and RSI resistance breakouts.
2) Confirmation of support on past resistance as sellers capitulate with boredom.
3) Resistance not until

MAPS - Cannabis related Company - Hot SectorWM Technology Inc is a technology and software infrastructure provider to the cannabis industry. It comprises B2C platform Weedmaps, and B2B software WM Business.
This is not a financial advice!
Weed related company - Sector is hot right now.
Rel. Vol on 03/23/2024 at 3.59
We need to stay in a b

Cannabis PropositionConsidering the recent political shift regarding cannabis scheduling and the changing landscape of the drug war, I am closely monitoring the prolonged underperformance of the cannabis industry. Since the legalization of cannabis in Colorado and Washington state, proponents have touted the potential

MAPS has a long potentialPure technical analysis point of view, it signaled an Alpha candle from a good chart pattern. Has upside potential.

MAPS a technology and marijuana penny stock LONGMAPS on 240 minute chart is now in a significant breakout with spiking volume and dramatically
increased relative strength. The breakout was caused by the news that the Biden administration
and specifically VP Harris will now push to legalize marijuana and take it off the DEA's
controlled substa

WeedMaps is undervalued WeedMaps technology has the potential to become the Uber equivalent for the cannabis industry, primarily because of the substantial customer base already associated with Weedmaps. This stock seems poised for growth, especially considering the global acceptance and legalization of cannabis, as well a
WM - Maps To Greener TendiesPrice action has spent months forming a solid bottom and looks to be making the first moves of a breakout.
The Chikou span is up crossing price action, which generally precedes a breakout.
Senkou span is acting as support, aligned with our first support zone.
I would expect the price action to

WM Technology Inc. - Weed Maps $MAPS Chart AnalysisTAKE A HIT OR LET IT SIT?
On the weekly, $MAPS appears to be smoking on the Bobby Brown and following suite via cannabis sector from Feb. '21, but can this ticker start puffing on big clouds to get some investors high on profits? - Soon, soon...
As it sits right now, we are completing the 4th wa

See all ideas
Summarizing what the indicators are suggesting.
Neutral
SellBuy
Strong sellStrong buy
Strong sellSellNeutralBuyStrong buy
Neutral
SellBuy
Strong sellStrong buy
Strong sellSellNeutralBuyStrong buy
Neutral
SellBuy
Strong sellStrong buy
Strong sellSellNeutralBuyStrong buy
An aggregate view of professional's ratings.
Neutral
SellBuy
Strong sellStrong buy
Strong sellSellNeutralBuyStrong buy
Neutral
SellBuy
Strong sellStrong buy
Strong sellSellNeutralBuyStrong buy
Neutral
SellBuy
Strong sellStrong buy
Strong sellSellNeutralBuyStrong buy
Displays a symbol's price movements over previous years to identify recurring trends.
Curated watchlists where MAPS is featured.


Frequently Asked Questions
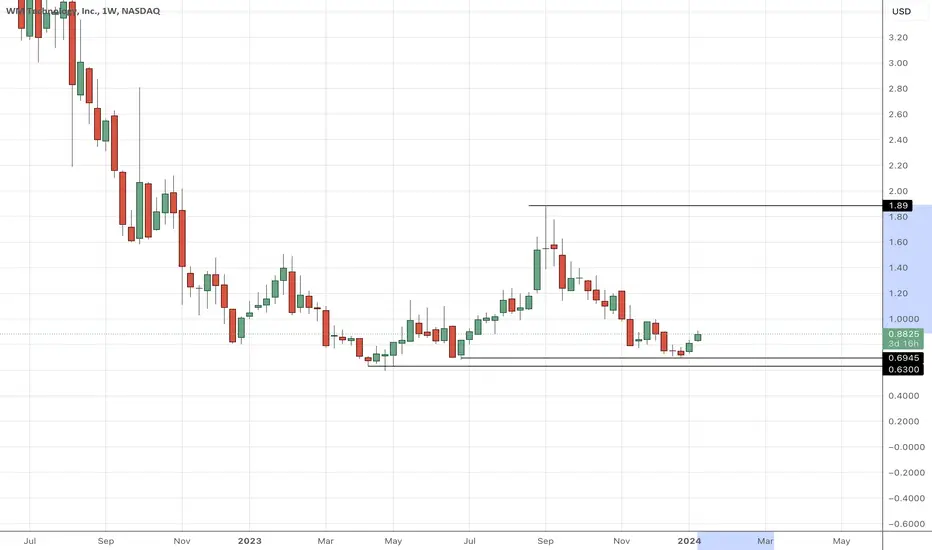
The current price of MAPS is 0.9323 USD — it has increased by 3.36% in the past 24 hours. Watch WM Technology, Inc. stock price performance more closely on the chart.
Depending on the exchange, the stock ticker may vary. For instance, on NASDAQ exchange WM Technology, Inc. stocks are traded under the ticker MAPS.
MAPS stock has risen by 3.59% compared to the previous week, the month change is a 0.25% rise, over the last year WM Technology, Inc. has showed a −0.55% decrease.
We've gathered analysts' opinions on WM Technology, Inc. future price: according to them, MAPS price has a max estimate of 2.61 USD and a min estimate of 2.61 USD. Watch MAPS chart and read a more detailed WM Technology, Inc. stock forecast: see what analysts think of WM Technology, Inc. and suggest that you do with its stocks.
MAPS reached its all-time high on Feb 17, 2021 with the price of 29.5000 USD, and its all-time low was 0.5960 USD and was reached on Apr 26, 2023. View more price dynamics on MAPS chart.
See other stocks reaching their highest and lowest prices.
See other stocks reaching their highest and lowest prices.
MAPS stock is 5.60% volatile and has beta coefficient of 0.60. Track WM Technology, Inc. stock price on the chart and check out the list of the most volatile stocks — is WM Technology, Inc. there?
Today WM Technology, Inc. has the market capitalization of 97.94 M, it has decreased by −2.21% over the last week.
Yes, you can track WM Technology, Inc. financials in yearly and quarterly reports right on TradingView.
WM Technology, Inc. is going to release the next earnings report on Nov 5, 2025. Keep track of upcoming events with our Earnings Calendar.
MAPS earnings for the last quarter are 0.01 USD per share, whereas the estimation was 0.04 USD resulting in a −75.00% surprise. The estimated earnings for the next quarter are 0.04 USD per share. See more details about WM Technology, Inc. earnings.
WM Technology, Inc. revenue for the last quarter amounts to 44.85 M USD, despite the estimated figure of 45.05 M USD. In the next quarter, revenue is expected to reach 44.55 M USD.
MAPS net income for the last quarter is 1.43 M USD, while the quarter before that showed 1.65 M USD of net income which accounts for −13.36% change. Track more WM Technology, Inc. financial stats to get the full picture.
No, MAPS doesn't pay any dividends to its shareholders. But don't worry, we've prepared a list of high-dividend stocks for you.
As of Aug 9, 2025, the company has 457 employees. See our rating of the largest employees — is WM Technology, Inc. on this list?
EBITDA measures a company's operating performance, its growth signifies an improvement in the efficiency of a company. WM Technology, Inc. EBITDA is 34.18 M USD, and current EBITDA margin is 17.23%. See more stats in WM Technology, Inc. financial statements.
Like other stocks, MAPS shares are traded on stock exchanges, e.g. Nasdaq, Nyse, Euronext, and the easiest way to buy them is through an online stock broker. To do this, you need to open an account and follow a broker's procedures, then start trading. You can trade WM Technology, Inc. stock right from TradingView charts — choose your broker and connect to your account.
Investing in stocks requires a comprehensive research: you should carefully study all the available data, e.g. company's financials, related news, and its technical analysis. So WM Technology, Inc. technincal analysis shows the sell today, and its 1 week rating is sell. Since market conditions are prone to changes, it's worth looking a bit further into the future — according to the 1 month rating WM Technology, Inc. stock shows the sell signal. See more of WM Technology, Inc. technicals for a more comprehensive analysis.
If you're still not sure, try looking for inspiration in our curated watchlists.
If you're still not sure, try looking for inspiration in our curated watchlists.