Just In: $META Up 3% Premarket Trading Today After Q4 Beat.In a surprising turn of event, shares of Microsoft fell in Europe on Thursday after it issued a downbeat forecast for its cloud business, while Facebook parent Meta shares ( NASDAQ:META ) rose after beating expectations, as investors scrutinised the companies' spending on artificial intelligence.
Microsoft shares traded down 4.5% on the Frankfurt market, having fallen a similar amount in after-hours trading on Wednesday and finishing the regular session down 1.1%.
Meta shares however, opened up 2.5% in Germany, having risen 2.1% after the closing bell and ending the regular session up 0.3%.
Days after Chinese upstart DeepSeek revealed a breakthrough in cheap AI computing that shook the U.S. technology industry, the chief executives of Microsoft and Meta defended massive spending that they said was key to staying competitive in the new field.
Meta CEO Mark Zuckerberg said Wednesday’s that the rapid rise of competitors from China has only strengthened the tech giant’s commitment to its AI ambitions.
The CEO said it’s too early to know how growing competition from China could impact its future investments. Meta reiterated its forecast of $60 billion to $65 billion in capital expenditures this year.
Technical Outlook
as of the time of writing, NASDAQ:META shares is up 2.81% in Thursday's premarket session. NASDAQ:META closed Wednesday's session with the overbought Relative Strength Index (RSI) of 71.87. however, NASDAQ:META doesnt seem to be cooling off any moment with the shares moving above key MA this only solidifies the fact that NASDAQ:META could bridged the $700 pivot point. However, in the case of a drawback, NASDAQ:META 's should find support in the 38.2% Fibonacci retracement point a level that aligns with the $640 price action.
META trade ideas


Mega cap earnings watchMega cap earnings get started today. Here's a comparison chart of META, TSLA, MSFT, AAPL, GOOG & AMZN. With the ticker Tracker MFI oscillator on the 1 day ext chart 3 month view. Below is the list of dates and times of their earnings release.
META 1/29 4:05pm
Consensus
EPS = 6.68
Revenue = 46.98 B
TSLA 1/29 4:05pm
Consensus
EPS = .75
Revenue = 27.61 B
MSFT 1/29 4:05pm
Consensus
EPS = 3.11
Revenue = 68.75 B
AAPL 1/30 4:30pm
Consensus
EPS = 2.36
Revenue = 124.1 B
GOOG 2/4 4:05pm
Consensus
EPS = 2.12
Revenue = 81.38 B
AMZN 2/6 4pm
Consensus
EPS = 1.52
Revenue = 187.13 B

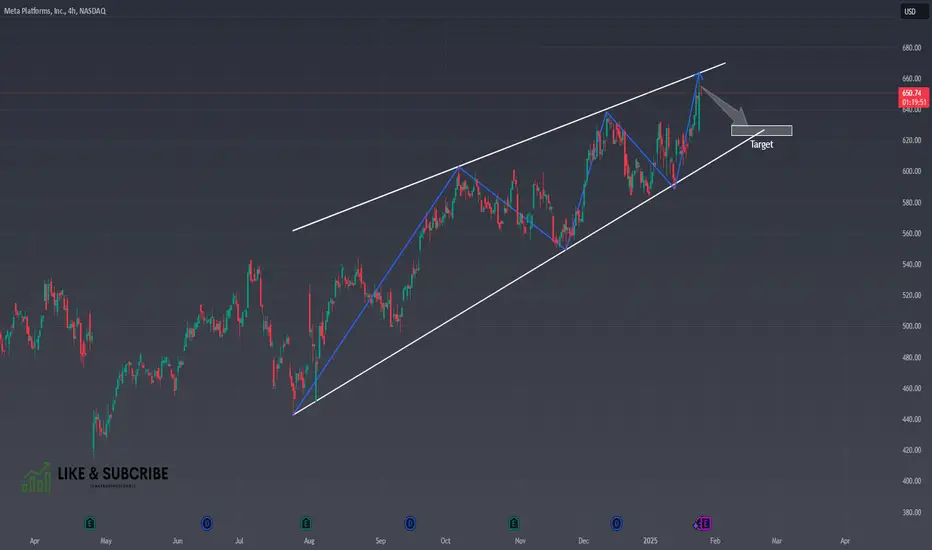
META Short: Towards EarningsSimilar to my Amazon's idea, I believe that META is also going to go up to a Fibonacci extension level of around $651.66 and then start it's decline. It might also be an earnings play where it will announce earnings that exceeds expectations, gapped up, and then sell down.


META: Bullish Momentum Holding, but Resistance Must Be Cleared🔥 LucanInvestor's Strategy:
🩸 Short: Below $670, targeting $650. If it breaks below the 9 EMA, downside pressure could accelerate.
🩸 Long: Above $680, targeting $720. A strong breakout continuation would confirm the bullish trend.
🔥 LucanInvestor's Commands:
🩸 Resistance: $680 — Crucial level to maintain for further bullish momentum.
🩸 Support: $653 — Key support zone aligned with the supertrend indicator.
Meta has surged into new highs, supported by an upward MACD crossover and strong volume. Holding above resistance is key for further upside, while losing momentum could trigger a correction.
👑 "The path to dominance is forged through strength and precision."


META Platforms Options Ahead of Earnings If you haven`t bought META before the rally:
Now analyzing the options chain and the chart patterns of META Platforms prior to the earnings report this week,
I would consider purchasing the 660usd strike price Calls with
an expiration date of 2025-2-21,
for a premium of approximately $32.20.
If these options prove to be profitable prior to the earnings release, I would sell at least half of them.

US Stocks to Watch This WeekDeepSeek triggered NVidia meltdown forced many investors to Exit NVidia positions and that money is flowing into some other stocks.
Following stocks have surfaced above of the cloud (consolidation zone) as detected by Option Scalper indicator:
1. ABT
2. META
3. WMT
4. V
5. NFLX
6. MA
7. JNJ
8. CRM
9. HD
10. ACN
11. PEP
12. TMO
13. JPM
14. PG
15. COST
16. BRK.A
17. AMZN
18. KO
19. WFC
20. LLY
Following Stocks have broken below the consolidation zone:
1. NVDA
2. AVGO
When the up or down momentum fades in any stock, it will come inside the cloud and that is the time to exit. Happy Trading!

SHORT META Ahead of Earnings Report Based on Insider Selling"Meta Platforms Insider Sold Shares Worth $22,132,922"
Mark Zuckerberg, 10% Owner, Director, Chair of Board and Chief Executive Officer, on January 15, 2025, sold 35,921 shares in [eta Platforms. Following the Form 4 filing with the SEC, Zuckerberg has control over a total of 353,696 shares of the company, with 353,696 controlled indirectly.
Jennifer Newstead, Chief Legal Officer of Meta Platforms sold 905 shares of Class A Common Stock on January 14, 2025, at a price of $604.54 per share, totaling $547,108. Following the transaction, Newstead directly owns 31,105 shares of Meta Platforms.
Jennifer Newstead, Chief Legal Officer of Meta Platforms, sold 905 shares of Class A Common Stock on January 21, 2025, at a price of $618.0 per share, totaling $559,290. Following the transaction, Newstead directly owns 30,200 shares of Meta Platforms.
The sales were conducted under a Rule 10b5-1 trading plan adopted on November 30, 2023.
Olivan Javier, Chief Operating Officer of Meta Platforms, sold 413 shares of Class A Common Stock on January 21, 2025, at a price of $618.0 per share, totaling $255,234. Following the transaction, Javier directly owns 16,275 shares and indirectly owns 95,287 shares through various entities.
The sale was conducted under a Rule 10b5-1 trading plan adopted on August 30, 2023.

I missed my entry; I will participate if....Super enjoying missing this great entry presented today. I do feel like it's to late now, we got earnings soon, and entering this high is just asking for a drawdown. Earnings can present a good entry point if earnings respect the expansion trend. No red numbers


META Approaching Crucial Resistance! Trade Setups for Jan 23
Analysis:
Meta Platforms (META) has seen a strong upward move and is now trading close to a critical resistance zone near $650. The price action and gamma levels suggest a potential continuation or retracement scenario.
Technical Observations:
1. Trend Analysis:
* META is in a clear uptrend, supported by higher highs and higher lows.
* The price is forming a rising wedge, indicating potential bullish momentum but also a risk of reversal if key levels are breached.
2. Key Levels:
* Resistance: $652 (recent high and 3rd call wall), $700 (highest GEX/call resistance).
* Support: $633.43 (immediate support), $603.65 (major support level and put gamma wall), $580 (next key level).
3. Indicators:
* MACD: Currently showing slight bearish divergence, signaling potential short-term weakness.
* Stochastic RSI: Approaching overbought territory, suggesting caution for longs.
4. Volume Profile:
* Increased buying volume during the recent rally indicates strong bullish interest but may slow as META nears resistance.
GEX Insights:
1. Call Walls:
* Key Call Levels: $652 (3rd call wall) and $700 (highest positive GEX and gamma resistance). Breaching $652 could open the path to $700.
2. Put Walls:
* Key Put Levels: $603.65 (strong support zone) and $580 (next major support).
3. IVR and Options Activity:
* IVR: 43.5 (slightly above average volatility).
* Options Flow: Call volume dominates with a 29.9% skew, reinforcing bullish sentiment.
Trade Scenarios:
Bullish Scenario:
* Entry: Break above $652 with strong volume.
* Target: $680 (intermediate resistance) and $700 (long-term target).
* Stop-Loss: Below $640 to limit downside risk.
Bearish Scenario:
* Entry: Rejection at $650-$652.
* Target: $633.43 (immediate support) and $603.65 (key support).
* Stop-Loss: Above $655 to minimize losses.
Actionable Suggestions:
* Closely watch price action around $650-$652. A breakout could accelerate upward momentum, while rejection signals a pullback.
* Monitor options flow for shifts in sentiment, particularly near $652 and $700.
* Be cautious of overbought signals from the Stochastic RSI when considering long positions.
Disclaimer: This analysis is for educational purposes only and does not constitute financial advice. Always do your own research and manage your risk before trading.


META Bullish Momentum – Targeting $639!🚀 META Bullish Momentum – Targeting $639! 🚀
📊 Trade Setup:
Take Profit 1: $610.00
Take Profit 2: $639.00 (previous high)
Stop Loss: $578.92 (below demand zone and channel support)
📈 Analysis:
META has been trading in a strong uptrend channel for the past 3 months, consistently forming higher highs and higher lows. With a positive opening on the first trading day of 2025 , the stock has already seen a +2% increase , reflecting s trong bullish sentiment.
The price is now approaching key resistance levels at $610 and the previous high at $639. A breakout above these levels could drive prices even higher, confirming the continuation of the uptrend.
🎯 Targets:
$610.00: Short-term resistance
$639.00: Previous high and key breakout zone
🔹 Risk Management:
Stop loss placed at $578.92 , just below the demand zone and channel support, ensuring controlled risk if the trend reverses.
⚡ What do you think about META’s bullish momentum? Will it break above $639? Drop your thoughts below! ⚡

How To Trade META Using this 3 Step systemMeta should be on your watchlist
because during this bear
market you are looking
for opportunities to
capitalise
Meta NASDAQ:META is the opportunity
to capitalise Because:
The price is above the 50 ema,
the price is above the 200 ema
and finally, the price has gapped up
or is in a rally upwards
This is what I call the
rocket booster strategy
This is the 3 step system
you want to learn about
If you want to learn more about
this strategy
then rocket boost this content
and watch this video again.
Disclaimer: Trading is risky, please learn
risk management and
profit-taking strategies.Also
feel free to use a simulation trading account

The Incredible Return of MetaI always find it fascinating to study stocks that have "returned from the dead" and made comebacks no one saw coming. I'll be the first to admit this: while I get some trades right, this one I got completely wrong. I thought Meta was on its way out in so many different ways. In fact, during its most recent crash in late 2022/23, I thought the final nail in the coffin had been struck.
But I was wrong.
Yes, I was very wrong. It's up over 600% since that point!
Looking at Meta's recent resurgence, I have to give Zuck credit where credit is due. He took bold swings, diving into AR/VR, AI, and cutting-edge technology like headsets. Something tells me there’s even more up his sleeve—possibly a phone of some kind. On a recent Joe Rogan podcast, he also had the guts to call Apple out in several distinct ways.
But what’s really caught my attention is Meta’s new data center. That, perhaps, is the bigger story here. The data center. Here are some impressive stats about the massive facility Meta has agreed to build:
1. Scale: The facility will span approximately 4 million square feet, making it Meta's largest data center to date, though still smaller than Langfang, China’s 6.3 million-square-foot behemoth.
2. Compute Power: By 2025, the center is expected to deliver around 1 GW of compute capacity—the same output as a typical U.S. nuclear power plant and enough to power about 1 million homes annually.
3. GPU Count: With over 1.3 million GPUs planned, this data center will dwarf the world's fastest supercomputer, Frontier, which uses 50,000 GPUs. The facility will be designed to handle enormous AI processing demands.
4. Capital Expenditure: Meta's projected capex for 2025 is $60–$65 billion, surpassing the GDP of countries like Iceland and Estonia and more than doubling Google's 2022 capex of $31 billion.
5. Bandwidth and Connectivity: Supporting 1.3 million GPUs will require unprecedented bandwidth and innovative networking solutions, potentially exceeding 100 Tbps.
I don’t plan on taking a position in Meta, but it’s certainly sparked my interest in the incredible investments happening in this space. Specifically that we are in a stock picker's market and that many companies, the ones who have survived the recent years, are emerging now as the leaders. There is a rather large basket of moves like this that continue to shape up!
As I write this, I can’t help but think that more comebacks like this are on the horizon. I’ve been sharing ideas like these on my profile and have more to come. Stay tuned.


Meta’s Charts Show Caution Signs Ahead of Next Week’s EarningsFacebook parent and “Magnificent Seven” member Meta Platforms NASDAQ:META will release fourth-quarter earnings next Wednesday (Jan. 29) after the bell. Let’s check out social-media giant’s technical and fundamental picture heading into the report.
Meta’s Fundamental Analysis
Over the past four quarters, META has moved 9.9% on average the day after reporting earnings. So, expect the potential for significant volatility and be mentally prepared for it.
As I write this about a week ahead of earnings, a combination of one META call and one META put that are both 10% out of the money are trading for about $19 in combined premiums. That’s less than 3% of the stock’s $636.45 Thursday close.
Analysts’ consensus view at last check was for the company to report $6.75 in GAAP earnings per share on roughly $47 billion of revenues. That would compare very well to the $5.33 in GAAP earnings per share that META reported on $40.1 billion of revenues a year ago, reflecting about 17% in year-over-year sales growth.
Digging into META’s financials, the firm has been a cash-flow beast.
The company had $82.7 billion in operating cash flow as of Sept. 30. And after capital expenditures, the firm still created $52.1 billion in free cash flow.
Of that, META used $48.2 billion during the third quarter to repurchase common stock while dishing out $3.8 billion in cash dividends to shareholders.
In short, the company returns free cash flow to its investors, which is how things really should be.
Looking at META’s third-quarter balance sheet, the company ran with a $70.9 billion cash position and $91.1 billion of current assets as of Sept. 30.
Current liabilities added up to $33.3 billion, which included no short-term debt and no unearned revenue. That makes the firm’s so-called current ratio easy to calculate as 2.73, which most investors would consider very healthy.
Total assets amounted to $256.4 billion, of which just $21.6 billion covered so-called “intangible” assets.
Total liabilities less equity came to $91.9 billion, including $28.8 billion of long-term debt. However, that's something that META could take care of almost 2-1/2 times over out of pocket with its Sept. 30 cash position, so that doesn’t look like an issue.
All in, many investors would say that the firm looks extraordinarily fundamentally sound.
Meta’s Technical Analysis
However, META’s six-month chart as of Wednesday (Jan. 22) seems to show that the stock doesn’t look as good technically as it does fundamentally:
What we see here is a lengthy “rising wedge,” as denoted by the green box above.
That’s historically a pattern of bearish reversal. In fact, the most positive thing we could say about this pattern is that the wedge doesn’t yet appear ready to close (which could provoke a violent move downward if that happens).
META’s Relative Strength Index (or “RSI,” the gray line at the chart’s top) is also better than neutral.
Similarly, the stock’s daily Moving Average Convergence Divergence indicator (or “MACD,” denoted by the black and gold lines and blue bars at the chart’s bottom) is in decent but not great shape.
The histogram of Meta’s 9-day Exponential Moving Average (or “EMA,” marked with blue bars) is ever so slightly above zero. And the 12-day EMA (the black line) is running above the 26-day EMA (the gold line), if just by a smidgen.
Add it all up and META’s downside pivot here would be the stock’s 50-day Simple Moving Average, denoted by the blue line above ($597.80 in the chart above vs. the stock’s $632.25 Thursday afternoon). The 50-day SMA appears to be running even with the rising wedge’s lower trendline.
However, check this other chart out:
This chart shows a so-called “double top” pattern of bearish reversal that stretched from mid-November to today (marked with two red boxes at right above). That pattern’s neckline -- $580 vs. Meta’s $632.25 as of Thursday afternoon -- would serve as the downside pivot here.
So, technical analysis is currently flashing two bearish patterns of reversal working against further upside momentum for the stock.
The one saving grace for META bulls is that the stock developed another double-top pattern back in September/October (the two red boxes at left).
However, that one didn’t lead to a big sell-off. So, there’s precedent here for META to defy bearish-looking technicals.
The bottom line -- caution is the word going into META’s earnings next week. The charts above don't necessarily mean that a sell-off is imminent, but there are some historically bearish technical set-ups in play.
Those who are long the stock should stay on their toes and might consider hedging their positions through the options market or some other way.
(Moomoo Technologies Inc. Markets Commentator Stephen “Sarge” Guilfoyle” had no position in META at the time of writing this column.)
This article discusses technical analysis, other approaches, including fundamental analysis, may offer very different views. The examples provided are for illustrative purposes only and are not intended to be reflective of the results you can expect to achieve. Specific security charts used are for illustrative purposes only and are not a recommendation, offer to sell, or a solicitation of an offer to buy any security. Past investment performance does not indicate or guarantee future success. Returns will vary, and all investments carry risks, including loss of principal. This content is also not a research report and is not intended to serve as the basis for any investment decision. The information contained in this article does not purport to be a complete description of the securities, markets, or developments referred to in this material. Moomoo and its affiliates make no representation or warranty as to the article's adequacy, completeness, accuracy or timeliness for any particular purpose of the above content. Furthermore, there is no guarantee that any statements, estimates, price targets, opinions or forecasts provided herein will prove to be correct. Moomoo is a financial information and trading app offered by Moomoo Technologies Inc. In the U.S., investment products and services on Moomoo are offered by Moomoo Financial Inc., Member FINRA/SIPC.
TradingView is an independent third party not affiliated with Moomoo Financial Inc., Moomoo Technologies Inc., or its affiliates. Moomoo Financial Inc. and its affiliates do not endorse, represent or warrant the completeness and accuracy of the data and information available on the TradingView platform and are not responsible for any services provided by the third-party platform.

Meta may have aquired tiktok bullish Tiktok was shut of to the US public for 13 hour.
Usualy a shut down is done when they want to move servers or do updates.
There was talk that poeple wanted to buy tiktok
Evidence is now pointing to tiktok changing to meta servers at this point.
Could this be a bullish signal for meta
We will see.
All i know is Im buying.

Meta is lining up for MAJOR upside thanks to possibly TikTok!TECHNICAL:
We have a strong W Formation forming on Meta.
We just need the price to break above the Neckline. Other indicators show Price is above the 20MA and the 200MA and things fundamentally are looking very strong for META going into 2025.
So first target will be at $796.97.
As Zuck is making major changes to make them more in line with X's policies and cutting some red tape.
FUNDAMENTAL RANT:
The whole TikTok ban and its quick comeback seem like a setup. On the same day TikTok got banned, Facebook conveniently made a TikTok account and told people to link their accounts. Oh, and guess what? Some senators just happened to buy Meta shares right before the ban.
Trump, who originally banned TikTok back in 2020, made a big deal about bringing it back, acting like a hero and making it all about himself.
I wouldn't be surprised if Meta announces a partnership with TikTok’s CEO, Mr. Chou, and possibly grab a 50% stake in TikTok to ease concerns about cybersecurity in the U.S. Meanwhile, Americans are jumping to Red Note— voluntarily giving their information away and because they are tired of the Oligarchy.

Inauguration Week: Opportunities in Meta, NZD, CAD, and $TRUMPInauguration Week: Opportunities in Stocks, Forex, and Crypto
Trump’s inauguration on January 20, 2025, marks the start of a new chapter for markets, with potential volatility from incoming executive orders.
Cryptocurrency
On January 17, 2025, Donald Trump surprised the industry by launching a meme cryptocurrency, $TRUMP, which has already reached a market capitalization of $72 billion according to Axios. Reports indicate that 80% of the token’s supply is controlled by Trump Organization affiliates, potentially adding over $50 billion to Trump’s net worth.
Forex
Some analysts predict the New Zealand and Canadian dollars could be vulnerable to US dollar strength this week, compounded by both countries set to release inflation data on January 21, 2025.
Stocks
The U.S. Supreme Court upheld a law requiring TikTok's Chinese parent, ByteDance, to divest U.S. operations. Meta, Alphabet’s YouTube, and Snap Inc. could benefit as advertisers redirect spending. However, Trump has indicated plans to issue an executive order delaying the ban, which may alter these projections unless Meta CEO Mark Zuckerberg can successfully leverage his new-found friendship with the incoming administration.
