META gave my setup for shortMETA August 3rd I gave my setup for short. We are on the way with short. I set take profit at 361.9 and target at 295. Then I will see what happens with this market.
META trade ideas

How will the upcoming recession impact META?NASDAQ:META
Although the macro environment is starting to look more negative for the equity market, I believe this to be one of the outliers that may still have some room to run.
Recent earnings showed a modest increase in spending designated for AI, which was a worry of mine going into earning with Zuckerberg's track record of overspending.
They seem to have investor focus with their current business model. This is truly a money printing machine.
At this time it's clear that any company wanting to spend ad dollars is turning to META first and will likely cut spending elsewhere. META's continued ability to help companies target their customers far exceeds that of any other ad-based company.
In addition to their improvements in ad revenue and daily active users across all their platforms, they have been able to make noticeable gains in both VR and AR markets.
How much longer until other hardware plays like Apple (AAPL) risk becoming obsolete? Obviously, it is way too soon to make a call against AAPL, but it seems they are behind the ball on everything they are rolling out. With AI helping developers create hardware, I think this may start cutting into AAPL's competitive advantage. If this ends up being true, META's development in hardware may begin to pay off.
Looking at the chart, it's hard not to see a double top with likely further downside coming in the future. This has also fallen below its 100-day MA and failed to hold levels above when retested it. If the downward pressure continues, I am going to be a huge buyer between $385 and $400. In the short term, I may buy some out-of-the-money puts with these targets and load up on calls if it retraces to the previous all-time high support.

Like the idea of where this is going for nowMACD crossover, room to run more on stochastic closing in on RSI, better coverage. It seems that on a bad day, due to the strength of the price based on guidance, Wall Street is seeing a continuation. I am bullish as BB shows still room on the upside, which has been the center of support and resistance.


META: Earnings and TechnicalsMETA jumped up to as high as 527 after earnings and quickly rejected resistance from April's highs. There are three things I am looking at with META stock. 1) the gap at 476 that will need to be filled and the gap at 392. 2) the fact that we could be in wave 3 down on the SPY which will cause a chain reaction throughout the market 3) The 1.618 Fibonacci retracement is set to around the area of the 392 gap that still needs to be filled.
I believe once this falls, it'll be one of the biggest gainers for PUT buyers.
PT1 474 and PT2 is 456

Meta Shares Surges on Impressive Q2 Earnings & AI-Driven FutureMeta Platforms ( NASDAQ:META ) experienced a notable 6% increase in its stock price following the release of its second-quarter earnings, which exceeded Wall Street expectations and presented an optimistic revenue forecast. The company's strategic investments in artificial intelligence (AI) are starting to deliver substantial returns, boosting confidence among investors.**
Strong Financial Performance
Meta reported a 22% increase in revenue for the second quarter, reaching $39.07 billion, up from $32 billion the previous year. This figure surpassed analysts' expectations of $38.31 billion. Additionally, the company's net income soared by 73%, rising to $13.47 billion, or $5.16 per share, compared to $7.79 billion, or $2.98 per share, in the same period last year. Analysts had predicted earnings per share of $4.73.
For the upcoming third quarter, Meta anticipates revenue to range between $38.5 billion and $41 billion, with a midpoint of $39.75 billion, again topping the average analyst estimate of $39.1 billion.
AI Investments Paying Off
Meta's leadership, including CEO Mark Zuckerberg and CFO Susan Li, highlighted that the company's substantial investments in AI are already yielding positive results. Zuckerberg noted that AI is enhancing content recommendations and improving advertising effectiveness, which he believes holds significant future potential. The company's advancements in AI are expected to unlock new revenue opportunities, including higher ad conversion rates, new digital assistants, and multimodal content creation.
Analysts at Baird emphasized that Meta's business remains robust, benefiting from years of AI-related investments. Similarly, Bank of America analysts view Meta as the leading AI player in the consumer internet space, citing evidence of strong ad growth and increased user engagement, particularly among younger demographics.
Capital Expenditures and Future Prospects
Meta has increased its capital expenditure forecast for the year to between $37 billion and $40 billion, up from the previous low-end estimate of $35 billion. This increase is primarily driven by spending on AI infrastructure, which is producing tangible business results. Barclays analysts noted that while the investment community is currently accepting the high AI capital expenditures, these investments are expected to bring new and exciting products that are not yet reflected in revenue forecasts.
Market Reaction
Meta's stock saw a premarket surge of over 7.5% following the earnings announcement. This rally marks a significant turnaround from the reaction to the previous earnings report in April when concerns over slower growth and high AI spending led to a sharp decline in stock price. The positive sentiment around Meta's recent performance and future prospects has reversed this trend.
Meta's Frankfurt-listed shares also experienced a rise of more than 7%, indicating strong international investor confidence.
Zuckerberg’s Wealth and Market Context
Meta's strong performance has also positively impacted CEO Mark Zuckerberg's net worth, which increased by $4 billion to an estimated $166.6 billion. Zuckerberg is currently the fifth richest person globally, behind Larry Ellison, Bernard Arnault, Jeff Bezos, and Elon Musk.
Broader Market Trends
Meta's success stands out against a backdrop of mixed results from other tech giants. Microsoft, Tesla, and Alphabet (Google's parent company) all saw declines in their share prices following their recent earnings reports, reflecting investor skepticism about the immediate payoffs from their AI investments. However, Meta's results suggest that strategic and well-executed AI investments can indeed deliver substantial short-term benefits.
Looking Ahead
As Meta continues to leverage its AI capabilities to drive growth and innovation, the company's future looks promising. Investors will be keenly watching the upcoming earnings report from Amazon, another major player expected to reveal significant AI-related capital expenditures. The broader tech industry's focus on AI underscores the transformative potential of this technology, with Meta currently leading the charge in demonstrating its value.
Conclusion
Meta's impressive second-quarter performance and optimistic outlook highlight the company's successful navigation of the evolving digital landscape through strategic AI investments. As Meta continues to innovate and expand its AI capabilities, it stands poised to capitalize on new revenue opportunities and maintain its position as a leader in the tech industry.

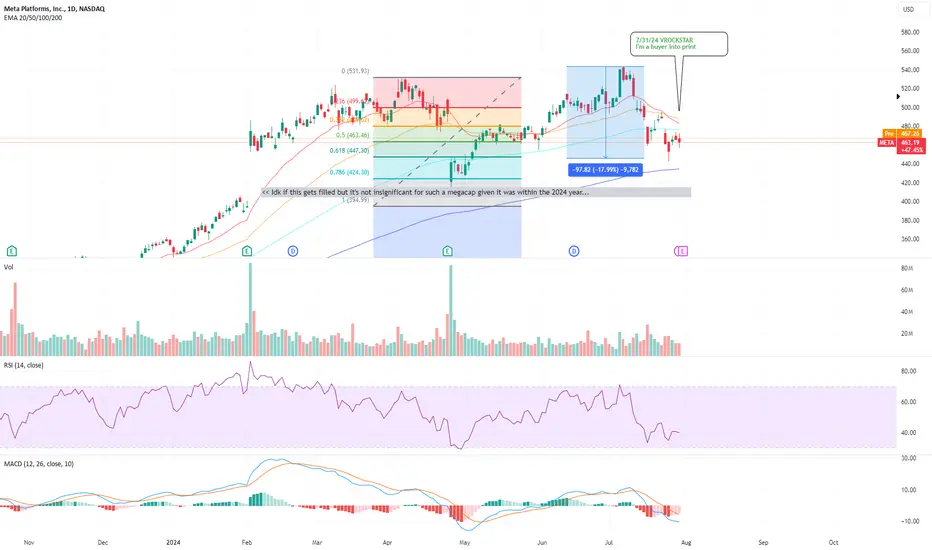
7/31/24 - $meta - I'm a buyer into print7/31/24 :: VROCKSTAR :: NASDAQ:META
I'm a buyer into print
- low 20s PE for CAGR'ing close to 20% for the N2Y seems reasonable
- 4% fcf yield growing DD is way better than T's/ cash
- Llama and it's internal applications are transformative, and I suspect we'll hear a LOT about this
- Read this post and it pushed me over the edge in terms of what the main customers (ad buyers) are thinking:
x.com
- Has held up better among the mag7's in this recent dippity dip. Furthermore, after see'ing MSFT's print, reaction and re-bid (cloud miss b/c they couldn't meet demand that's coming 2H) gives me more confidence in the compute story and specifically for those who are monetizing the app layer > infra deployments i.e. META
lmk what you think. I've got a 50 bps position (trading) but willing to make it 1% over the day as we see how risk evolves and fed drives overall risk (remember the majority of moves are dictated by broader risk/ liquidity).
fwiw - i will be selling down some of my nvda/ tsm today after piling into it y/day. will still hold some exposure but will be taking some gains for being the odd one out and necking out. perhaps more to go, but prefer to remain nimble raising a bit more cash.
V
META Shares Rise Above $500META Shares Rise Above $500
Yesterday, after the close of the main trading session, social media giant META reported its second-quarter results, significantly exceeding analysts' expectations:
→ Earnings per share: actual = $5.16, forecast = $4.72;
→ Revenue: actual = $39.07 billion, forecast = $38.26 billion;
→ Daily active users increased by 7% year-on-year to 3.3 billion;
→ Ad impressions grew by 10%, and ad prices increased by an average of 10%.
CEO Mark Zuckerberg stated that the integration of AI across all platforms, including Instagram, WhatsApp, and Facebook, is driving engagement growth.
Investors were undeterred by the fact that Reality Labs, the division focused on metaverse development, reported a loss of around $4.5 billion for the second quarter, bringing its total loss since its inception in 2020 to $50 billion.
As a result, during after-hours trading, META’s share price rose by 7%, surpassing the psychological $500 level.
What Could Happen Next?
On 19 July, our analysis of META’s chart identified an ascending channel (shown in blue) and highlighted the importance of support at the $455 level.
Since then, the share price attempted to break this level on 25 July, but this led to a surge in demand, with META’s price rising sharply and forming a candle with a long lower wick.
In pre-market trading today, META's price is above $505, and the main session is likely to open around these levels.
Technical analysis of META’s daily chart shows that:
→ The price is confidently returning within the channel boundaries;
→ Despite bearish signals from the July highs, strong fundamental data is helping bulls overcome these signals;
→ A broad bullish gap is likely to form on the chart, potentially serving as a support zone and aiding price movement within the current ascending channel.
According to TipRanks, Wall Street analysts have a 12-month target price for META of $549, suggesting potential growth towards the median line of the channel.
This article represents the opinion of the Companies operating under the FXOpen brand only. It is not to be construed as an offer, solicitation, or recommendation with respect to products and services provided by the Companies operating under the FXOpen brand, nor is it to be considered financial advice.

META may start to go bullish?Meta shares jumped 7% after hours. This is because Meta's latest earnings report exceeded expectations across the board: revenue was $39.07 billion, up 22% year-over-year, and net profit was $13.465 billion, up 73%.
Technical speaking, Meta stock price has broken below the uptrend line and then found support at the previous gap down candle with high trading volume, initiating a rebound.
Currently, the price has rebounded to the resistance level around 476, which share same level with the lower edge of the previous gap .
If the price fails to break above this resistance level, it might probably drop more. on the contrary, it might start to go bullish after the valid breakout.

METAMETA is in bull trend with no divergence at top and testing its fib retracement of 0.5-0.618 while maintain its last HL
buy the dip with sl mentioned

META - those who missed it , this is your chance Read latest news here
Post trading hours, the company has fallen nearly 20% to reach the current price of 418.85.
I will be waiting patiently for the gap to be closed and see if there is bullish signals before going long.
Tech stocks have gone up a lot, short term traders will be smart to take profits, investors - chill and await good opportunities to accumulate.

METAWave analysis .We have golden area of up move either short one ending around 504 -519 representing C of zigzag then move down to 411.53 after break of 442.65 then 427.34
Other option is to continue up breaking 542.81 in motive wave of 5 parts to be discussed later
Good luck

ExhaustedYes, we are in a downtrend already. Are we? But today's fall was way to steep. Thus we could not fall below the 31st May low.
The stock is oversold and shall probably correct now.

META to 1,000 before Jan2026I feel this is early, but definitely bullish.
$1,000 long term IMO
Not financial advice, I like swinging and positioning.

META: The Tech Sector Still Has LifeMETA is not showing anything to me at the moment (give it a day or two), but I thought I'd post this for one of my followers. META is banded in what is becoming a wedge pattern. If it breaks below $442, expect to see $414. If it stays in the wedge, expect to see $489 again and even higher. My prediction is that it does stay inside the wedge being that the gap from February was mostly filled. This stock has always been volatile, so expect a big move come earnings. My bet is a big move up.

META - Bullish weekly close!! WATCHOUT- Small market buy on Monday's open wouldn't be bad although we might get a small retrace before bullish continuation.
- Long entries starting from $524 - $510 would be ideal.
- In case price keeps dumping, $500 ish will be the ultimate perfect long entry.
- Trade invalidation upon price breaking below $490.

Similar Crazy Idea on METAHuge Harmonic completion on META completing right at 2021 resistance. Seems nuts, wouldn't predict this will happen but ya never know


Meta/Facebook. Trumponomics related stock. 29/July/24FB / Meta share price probably either fixed by Donald before ..or will be adjusted by Trump after election..218 +/- is strong support as confluence zone.

META Stock Chart Fibonacci Analysis 072824Trading Idea
1) Find a FIBO slingshot
2) Check FIBO 61.80% level
3) Entry Point > 447/61.80%
Chart time frame : B
A) 15 min(1W-3M)
B) 1 hr(3M-6M)
C) 4 hr(6M-1year)
D) 1 day(1-3years)
Stock progress : B
A) Keep rising over 61.80% resistance
B) 61.80% resistance
C) Hit the Support
D) Hit the top
Stocks rise as they rise from support and fall from resistance. Our goal is to find a low support point and enter. It can be referred to as buying at the pullback point. The pullback point can be found with a Fibonacci extension of 61.80%. This is a step to find entry level. 1) Find a triangle (Fibonacci Speed Fan Line) that connects the high (resistance) and low (support) points of the stock in progress, where it is continuously expressed as a Slingshot, 2) and create a Fibonacci extension level for the first rising wave from the start point of slingshot pattern.
When the current price goes over 61.80% level , that can be a good entry point, especially if the SMA 100 and 200 curves are gathered together at 61.80%, it is a very good entry point.
As a great help, tradingview provide these Fibonacci speed fan lines and extension levels with ease. So if you use the Fibonacci fan line, the extension level, and the SMA 100/200 curve well, you can find an entry point for the stock market. At least you have to enter at this low point to avoid trading failure, and if you are skilled at entering this low point, with fibonacci6180 technique, your reading skill to chart will be greatly improved.
If you want to do day trading, please set the time frame to 5 minutes or 15 minutes, and you will see many of the low point of rising stocks.
If want to prefer long term range trading, you can set the time frame to 1 hr or 1 day.

Wanna take a ride on META rocket to moon ? - Lets reviewAnalyzing the chart for META, I found it has recently reached its support and is ready to take off soon. It’s better to find a seat before it heads to the moon.
The support level is around $452, with target prices at $504 (TP1), $532 (TP2), and $600 (TP3), as indicated in the graph. My charts are usually simple, with just support and resistance lines (different patterns). I use the RSI graph and volume to support my patterns.
As usual, my advice is not to invest all your money at once. There's a bit of risk with the upcoming earnings report, so consider buying in dips to mitigate potential losses.
This graph is based on my observations. I encourage you to conduct your own analysis before investing or trading any amount in any stock.
Thank you

Topped?Looking over counts here and there is a good chance that it's topped - I think a lot of these big tech stocks in general have topped/not far off and it's time to de risk.

$469-71 short to $400 METAI dowse stocks and indexes... Like, with a pendulum. It's very interesting & has kept me hooked because things sometimes work out.
Anyway, my dowsing was bringing my attention to META today, so I did a reading on it. The chart shows the basics, and I ask twice if I'm missing anything, and I literally get the "black swan/crash" option... TWICE! This is definitely unusual and it claims this occurs 5 days from now, which is next Wednesday, (coincidentally) Fed day.
I've said all year they will not lower rates, so maybe the market finally has a tantrum about it.
Whatever it is though, I have META topping out around here and I definitely feel this is a back the truck up moment (for me, not saying for you!) after an insane rally.
META could definitely go a bit higher because lots of times I get just the next high, like high of the day, and the next day it goes higher (& I get annoyed). But it seems like even if that happens, the downside will more than make up for a little heat.
Target could go down to $395, but anywhere around $400 is good profit from here.
I have a date of 8/12, or maybe 14th, as a possible low on indexes & NVDA, so thinking META falls in there as well. I will have ideas posted on them too with some other "woowoo" details if you're into that.
Be careful and good luck!
