META gap supportRSI divergence for last two peaks.
RSI not over sold yet.
Before the earnings #META might test gap support 450 ish
META trade ideas

META: Is it the top or one more high leftTechnically META top could be in. Like NVDA, it can keep sliding until a critical support level breaks and waterfall ensues. However, the last wave 5 of 5 did not quite end in a blow off top type fashion; something you would expect from a major primary degree top. There was however, significant RSI bearish divergence on the daily timeframe, that tells us it was some kind of a top. I am not sure if it was a wave 5 of 5 top or a wave B or 4 type of top on the minor degree. One way to tell would be for $460 - $450 support to hold. If that does not hold and stock slides to fill the large gap, then that weakness would be very difficult to overcome and one thing would lead to another thing and next thing we know, price will be in the 200s. So, that is my line/zone on the sand. This is however, a bit scary to stay long and potential upside is limited at the moment. It is better to see how things play out and eventually not in a distant future, there will be a great opportunity like late 2022 to get in this stock for a really life changing growth.

META / FACEBOOK SELL META SELL SIGNAL
SELL ENTRY - $494
SL - $519
CURRENT PRICE - $481
OBV volume trending down.

META eyes on $489.06: Golden fib, Double Top? or Pop to 564 ?META is pounding on a Golden Genesis fib at 489.06.
Notice the bottom EXACTLY on a Golden fib at 87.47.
Also see the peak at 198.47 and orbit around 309.57.
It is PROBABLE that we orbit this fib a few times.
It is POSSIBLE we have topped, at least temporarily.
It is PLAUSIBLE that it breaks and pops to the next fib.
Here is a full view and explantion of the Genesis Sequence:
==================================================================================================

META: Buy ideaBuy idea on META as you see on the chart if only if we have the breakout with force the resistance line and the vwap indicator by a big green candle follow by a large green volume! Thanks!

Meta
Earnings mid next week..
Sitting here on support of channel from last earnings gap up.
Over next few days i expect Meta to rebound to atleast 510.. a break over 510 and or that minor channel (White lines) and meta heads back to 520..
Long term i think this stock is headed for a major correction
Bearish divergence On RSI has been playing out for last 2 months.. Bearish divergence is just a Condition, You a need a trigger for the sell and earnings just may do it !
Long to 510 , over 512 and it heads to 520...

META - Long - TP 358Meta showing the tendency to go further higher to the levels of 358.
The stock is expected to hit the levels of 300 or even to 269 before moving to 350+.

META: TikTok-Induced Correction Afoot It looks like NASDAQ:META has found a meaningful top as more technical signals agree a short setup has formed.
Three significant trendlines have been broken, and today a significant fib retracement level was neatly rejected as TikTok drama continues its inevitable path of escalation.
It's tempting to immediately target the gap below, but there is a POC on the 4H that is perfectly confluent with the .786 fib retracement level that I would expect to act as a strong support level temporarily.
Technicals aside, META will certainly get caught in crossfire of some sort from further regulation of social media. Social media companies will likely struggle in sympathy as the situation continues maturing.
With an extraordinarily overheated macro backdrop, and an incredibly delicate geopolitical landscape, NASDAQ:META is liable to be put under additional pressure on its decline.

META PUTExpecting the price to test $508 zone and drop even further to $490 and $484 demand areas, as the price is seemingly showing early trend reversal signs.

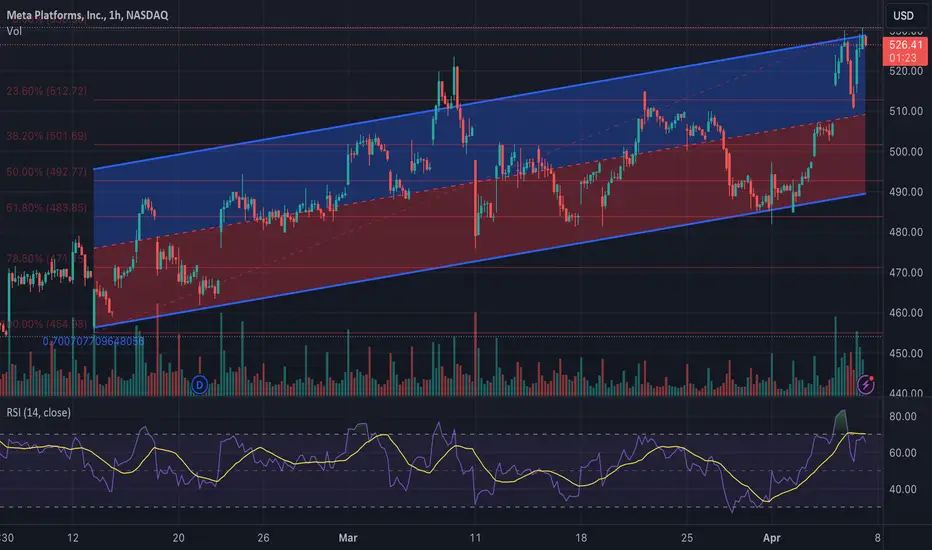
Meta Platforms, Inc. (META) Technical Analysis.Meta Platforms, Inc. (META) exhibits a compelling uptrend within a well-defined bullish channel, as observed on the hourly chart. The price action, confined within this ascending channel, points towards a consistent bullish bias, complemented by the recent rebound off the channel's lower boundary.
Channel Dynamics:
The ascending channel, marked by parallel trendlines, encapsulates the price fluctuations and serves as a guide for potential support and resistance zones. The lower boundary of the channel has successfully provided support, prompting rebounds on multiple occasions, while the upper boundary has capped upward movements, offering resistance.
Fibonacci Retracement Levels:
A Fibonacci retracement applied to the swing high and low reveals that price retracements have found support near key Fibonacci levels. The 61.8% retracement level, often referred to as the 'golden ratio', appears to align closely with the lower channel support, enhancing its significance.
Relative Strength Index (RSI):
The RSI indicator hovers around the 70 mark, indicating strong momentum but also approaching overbought territory. It is pivotal to monitor for any divergence that might suggest a weakening in the current trend's strength.
Volume Analysis:
Volume patterns display a healthy mix of buying and selling, with no significant anomalies to suggest a reversal is imminent. Spikes in volume correlate with key moves in price, affirming the validity of the trend.
Market Sentiment and Forecast:
The robust structure of the ascending channel, in conjunction with the RSI and volume analysis, posits that META is poised to continue its climb, with potential resistance at the upper channel boundary. Traders might anticipate pullbacks to the lower channel line as buying opportunities, while mindful observation of RSI levels and volume spikes could signal when the trend may be overextended.
Trade Strategy:
A prudent approach might involve setting buy orders on retracements to significant Fibonacci levels with stop losses just below the channel support. Profit targets could be set near the upper channel line or upon RSI indications of overbought conditions.
Conclusion:
Meta Platforms, Inc. presents a technical posture that favors continued upside, underpinned by the current price channel formation and supported by momentum indicators. Traders should remain vigilant for any signs of trend fatigue and prepare to adjust strategies accordingly should the technical landscape evolve.
META: Potential 5 to 10 Bagger in 2024Fundamentals:
If the NFP numbers explode up on Friday, then that means that the FED might have to increase rates, putting pressure on US companies' earnings. This may cause META to topple a bit before earnings. If not, then the same rate for longer. It is the first Friday of the week.
Sales have accelerated in META and earnings are above 20% q/q. However, its three-year earnings are below 5%. But if this changes when earnings come out in April 2024, then that will renew META as a super stock for 2024. It will be added to the two I already have: NOW, and NVO.
Technical Market Scenario:
The SPX500 has a 2.5%-10% market correction. Then rallies to Around 6000 By End of 2024.
Technicals:
ON the daily chart, META broke out and pulled back with higher volume, signaling caution for tomorrow. If it does not continue tomorrow, then I anticipate consolidation for the month in META, then an earnings breakout.
uHd with extreme bullish indicator.
META bounced off of daily 486 horizontal support.
Daily flag pole breakout
Daily Chart:
Weekly Chart:
Comment:
If the above scenario plays out and insider and investor expectations increase or are solid, then I expect META to be at $600 to $1000 within 12 months. However, If META topples, then there is a large buy zone area to watch at $400; a confluence area of a 50% fib, horizonal support from September 2021's all-time high and kijun support.

Meta Surged to New Heights is there Room for Continued Growth Meta and Amazon stocks have risen following an increase in their price targets by a Wall Street analyst team. Jefferies, the analysts, reiterated a buy rating for Meta ( NASDAQ:META ) and raised their price target for the Facebook parent company to $585 from $550. Additionally, they raised their price target for Amazon stock to $225 from $190. Meta's stock has risen more than 3.5% to $525.62, and Amazon's stock is up more than 1% at $184.88, approaching an all-time high above $188 reached in July 2021.
Jefferies' report stated that Meta ( NASDAQ:META ) has too many advantages to count compared to competitors in the digital advertising market. Meta's revenue is mostly driven by ads, and the company has been investing in artificial intelligence tools to help drive more engagement and ad sales on its applications. They include Facebook, Instagram, Reels, WhatsApp, and Threads. As a result of these investments, Meta ( NASDAQ:META ) has developed several strategic advantages over peers, such as a strong artificial intelligence-based recommendation engine for its Reels short-video product that is driving more time spent on Facebook and Instagram.
Meta ( NASDAQ:META ) is set to report its first-quarter earnings on April 24 and has seen a 47% increase in its stock price this year. In addition, Meta Platforms Inc. ( NASDAQ:META ) is reintroducing cash bonuses for content creators on its social media apps. The company is testing the "Spring Bonus" initiative in the United States, South Korea, and Japan, rewarding creators on Instagram for engagement not just on videos and reels, but pictures as well. The maximum creators can earn in thirty days is $30,000. The company will also similarly reward select creators for engagement on Threads, its Twitter-like social app, and content labeled as "collaboration" or "branded" will not be eligible for monetization.
Technical Outlook
Meta ( NASDAQ:META ) for 20 weeks now has been trading above the 200, 100 and 50-day Moving Averages respectively with a Relative Strength Index (RSI) of 63 indicating strong bullish sentiment.

Identifying a Bullish Pennant on Meta's 1-Day ChartThis lesson examines a potential bullish pennant forming on Meta Platforms Inc. (META), formerly Facebook, on its 1-day chart.
What is a Bullish Pennant?
A bullish pennant is a continuation pattern in technical analysis that suggests an asset's price is consolidating after a strong upward move. It's characterized by two converging trendlines, forming a pennant shape. The target price for a bullish pennant breakout is typically the height of the pennant added to the breakout point.
Identifying the Bullish Pennant on Meta's Chart:
On Meta's 1-day chart, we can observe:
Price Consolidation: Following a significant price increase, the price appears to be trading within a narrowing range between two converging trendlines. This consolidation phase suggests a potential pause before the uptrend resumes.
Target Price: By measuring the height of the pennant (the vertical distance between the trendlines), we can estimate a potential target price upon a breakout. Adding this height to the breakout point (the price where the price decisively breaks above the upper trendline) provides a preliminary target. In this case, a breakout above the resistance level could suggest a target price of $690
Important Considerations:
Confirmation from Other Indicators: While a bullish pennant is a positive technical signal, it's not a guarantee of a price increase. Look for confirmation from other technical indicators like:
Volume: Increasing volume on the breakout can strengthen the bullish case.
Moving Averages: A rising 50-day or 200-day moving average can indicate an underlying uptrend.
Relative Strength Index (RSI): An RSI value below 70 on the breakout suggests the stock isn't overbought, potentially allowing for further price appreciation.
Market Context: Consider any recent news or events that might be impacting Meta's stock price. Positive news can fuel the breakout, while negative news could hinder it.
Support and Resistance Levels: Identify key support and resistance levels on the chart. A breakout above a resistance level is more significant if it's accompanied by increasing trading volume.
Target Price: The target price based on the pennant pattern is an estimate, and the actual price movement could deviate significantly.
Conclusion:
The potential bullish pennant on Meta's chart suggests a possible continuation of the uptrend. However, it's crucial to use this information alongside other technical indicators, fundamental analysis, and proper risk management practices before making any investment decisions.

METAMETA is showing strong resilience, consistently bouncing off my trend line upon retesting. The upward momentum in META appears promising at this stage.

META to $455Overview
META is approaching a possible landslide that may take the share price to around $455. An influx of insider liquidation paired with healthy market skepticism supports the possible correction.
Fundamentals
Overall the company appears healthy according to their 2023 Annual Report. The only filings that I found concerning was the abundance of 144s that indicate insider liquidation. As of late, insider liquidation has been heavily present amongst most of the Magnificent Seven companies (GOOGL, AMZN, NVDA, and TSLA)
Technicals
A bear flag is forming after the rally momentum rounded out and is now beginning to develop a descending triangle. The oscillators don't support a breakdown at the current time so a possible bounce back to the triangle's resistance line around $505-510 is possible as the pattern continues to develop.

Stock Market Logic Series #9Two Daggers Buy Pattern EXPLAINED
This is a super powerful pattern for a buy. Especially if you are a value investor.
What do you want to look for?
1. You must see TWO daggers to the downside.
A dagger is an extremely abnormal drop in price with a HUGE volume.
You want to see the first dagger, and then pray for the price to continue falling at a normal rate.
Normal rate = people are trying to pick the bottom (without success).
Then you want to look for (wait = put alerts) for the SECOND DAGGER.
Then after the second dagger arrives and you get a second sharp drop in price, then you want to expect a rejection up and a new strong trend up should emerge.
2. Exterme volume on the daggers!
Ideally, you want the volume of the second dagger to be bigger than the first one.
This means that someone is loading all he can get since he KNOWS KNOWS KNOWS that the price is going to get higher for sure.
I bet you would have done the same... if you KNOW KNOW KNOW its going UP!
This pattern does not happen all the time, and it is more likely to happen near the end of a bear market. But prices get so unreasonably cheap, that its obviously for fundamental reasons that they are wrong! so someone who KNOWS will take all the money he can get to load into this stock at this price.

META short gap fill idea $474-78Dowsing (not technicals) give me a heads up to watch META and suggest a "spike down and reverse up". I did have a little intuitive hit this weekend that markets might have a decent move down on Tuesday. Anyway, I check for targets and it's in the zone of the gap fill, funny enough.
I'd be looking long around this area as much as I'd be looking for a short term short now.
I ask what to tell anyone who reads this and it says, "bear trap". We'll see!

Meta Madness: Big Crash or Further Surge After the Mega Rise?Meta is a particularly intriguing stock that experienced a significant selloff at the end of 2021, with an overall pullback of 77%. Since then, however, we've witnessed an extraordinarily robust surge of 444%, which is remarkably strong. Yet, this rise came without any interim corrections, raising questions about when such a correction might occur. We've concluded our Wave I in September 2020 and have since formed an ABC correction, ending Wave II at $88.41. Following this, we've seen a rise to, and here's where it gets interesting, two possible scenarios: either an overshooting Wave (B)—note that this would mean Wave 1 isn't where it currently is, but rather at the Wave (B) level of $384. If Wave (B) precisely hits 138% at $496, which we've exactly reached without exceeding, this is where our concern lies. We'd like to see Meta invalidate this scenario by surpassing the $496 mark for a larger pullback to occur. Primarily, however, we're inclined to believe that we're heading into a Wave (2) correction, expected to lie between 50 and 78.6%, that is, between $288 and $174. Following this, the trajectory for Meta is anticipated to climb significantly, but this remains a scenario for the distant future.

META 4HR CHARTAm I the only one who has noticed this channel META has been trading in? I mean technically this is an uptrend, and asset prices do trend. I will say it's struggling to stay above the 500 plus range. It got above it a few times, but not for long. So what happens here? Do we continue to trend up and eventually breakout, or do you see Meta give back these gains from when they introduced the dividend. That large candlestick is a gap on the daily chart down to 406.

EU Launches Probe Into Meta, Apple and GoogleIn a landmark move under the newly enacted Digital Markets Act (DMA), the European Union has initiated a comprehensive investigation into tech behemoths Apple, Alphabet (Google's parent company), and Meta (formerly Facebook). The probe, which marks the EU's first under the DMA, aims to scrutinize potential anti-competitive practices and ensure fair competition within the digital ecosystem.
The investigation, announced on Monday, encompasses a range of issues spanning from Apple's App Store policies to Google's search engine practices and Meta's advertising model. At the core of the probe are concerns regarding anti-steering rules, self-preferencing, and the implications of Meta's "pay or consent" model on user privacy and choice.
Apple and Alphabet, in particular, face scrutiny over their implementation of anti-steering rules, which prevent businesses from informing users about cheaper alternatives outside of their app stores. This investigation underscores the EU's commitment to fostering a level playing field for businesses and consumers alike, amidst growing concerns about the dominance of tech giants in shaping digital markets.
Notably, Apple's recent run-ins with the EU, including a hefty 1.8 billion euro fine for anti-competitive practices related to music subscription services, underscore the regulatory pressure facing tech giants operating within the European market. The probe into Apple's App Store policies and Safari browser further highlights the EU's focus on ensuring user choice and fair competition within the iOS ecosystem.
Meanwhile, Alphabet faces scrutiny over potential self-preferencing in Google search results, raising questions about the company's adherence to fair competition principles. With the EU probing whether Google's display of search results favors its own services over rivals', the investigation sheds light on the complex dynamics of digital markets and the challenges of regulating tech giants with vast influence over online ecosystems.
In the case of Meta, the investigation centers on the company's ad-free subscription model and its impact on user consent and data privacy. The EU's scrutiny of Meta's "pay or consent" model reflects broader concerns about the accumulation of personal data by tech gatekeepers and the need to provide users with meaningful alternatives.
As the EU's investigations unfold, tech giants are bracing for potential fines of up to 10% of their total worldwide turnover, highlighting the significant financial implications of regulatory non-compliance. Moreover, the probes underscore the evolving regulatory landscape facing tech companies, as policymakers seek to address concerns about market concentration, data privacy, and consumer welfare in the digital age.

META could fall from ATH SHORTMETA on the weekly chart is at the ATH which is as a consequence at the third upper VWAP line.
The RSI indicator shows the faster line crossing under the slower line. The relative trend
index has topped out. Both represent bearish divergence. META makes its money with
advertising dollars for revenue. There are increasing challengers to split revenues that could
go down if a recession happens. Other headwinds are the federal regulatory blaming META
for issues such as foreign interference in our elections, or child molestors floating on
the platform without adequate protections for minor or collusion in a monopoly with other
high flying targets. I find this to be a good juncture to take a short trade in META on a swing
looking for it to last until the next earnings period.

META bright future ROAD TO $300+Quest 3 is coming out any time this year on fall. This will be revolutionary.

Short Meta updateThe recent top is our first pivot point, we will anchor short entries below the 472 level with target 1 at the previous top 384. This is the first test trade against a pivot top and a tight stop range should be set.
There is a massive short coming which will be a steep fall, a crash fractal unless the cycle alters in an unlikely event.
Trade safe, stay connected..... good luck
