METC double bottom playing out - still earlyOn the chart, we can see that METC has formed a double bottom , and is showing bullish movements already.
RSI is showing bullish divergence and crossing.
It can be entered either at the
breakout point or at the current strong support level .
The first target is purely based on the forming of the s
Next report date
—
Report period
—
EPS estimate
—
Revenue estimate
—
−0.37 USD
11.19 M USD
666.29 M USD
28.36 M
About Ramaco Resources, Inc.
Sector
Industry
CEO
Randall W. Atkins
Website
Headquarters
Lexington
Founded
2015
FIGI
BBG00BCQJ2X3
Ramaco Resources, Inc. engages in the operation and development of coal mining properties. The firm deals with metallurgical coal in central and southern West Virginia, southwestern Virginia and southwestern Pennsylvania. Its portfolio consists of Elk Creek, Berwind, RAM Mine, and Knox Creek. The company was founded by Randall W. Atkins in August 2015 and is headquartered in Lexington, KY.
Related stocks

A LONG idea for this stockThis stock seems to be accumulated even when the markets are down. It seems like it has strong relative strength against the general market. More over it seems like it experiences growth in the last earning reports.
Here is my long plan for the next 1-4 days. If it hits my buying point I will probab

METC New 52 Week High*METC made a New 52 Week High yesterday
*Stock was under consolidation for past 4 Months
*Big breakout candle, over 2 times of average volume
*Price well above 200 DMA
*Paid dividend in this quarter

METC STRONGER THAN NASDAQ
FUrther Comparative ANalysis
Between METC & NASDAQ INDEX
Based on my point of interest, it can be conclude that METC for now is stronger than the Market
BUt if we look as a general Point, Nasdaq Is stronger than METC
Trading Strategy :
If this is a Trading range, i plan to ride the Automatic

Possible Cup formingClosed above Kumo, bullish Heiken Ashi, looks like a cup is forming, if price can make it to 18.8, a double top

US Stock In Play: $METC$METC based out from dec'21 and continues riding up its 20MA within a tight channel, also trading beyond its VWAP from ATH. ADR now is at 5.65% to price, and uptick in daily volume for 4 consecutive session.
this is the kind of behavior that may set for a parabolic move imho


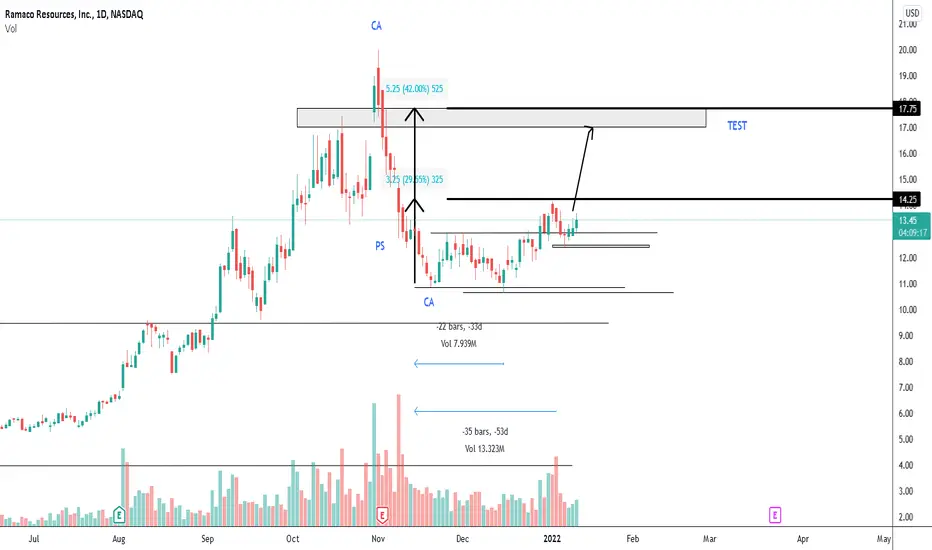
METC RAMACO
Currently possbily ongoing Phase A
Awaiting Confirmation of CHoCh (Change of character)
Estimated Automatic Reaction based on P&F Chart (Law Cause VS Effect)
Ramaco Resources (METC)-is improvingDow Jones US Coal Total Stock Market Index ($DWCCOA) is improving

METC - Oct1
METC - Oct1
JPMorgan raises year-end Brent target to $84 per barrel from $78; Goldman priced at $90, BofA sees > $100
so that expicted
good luck with it

See all ideas
Summarizing what the indicators are suggesting.
Neutral
SellBuy
Strong sellStrong buy
Strong sellSellNeutralBuyStrong buy
Neutral
SellBuy
Strong sellStrong buy
Strong sellSellNeutralBuyStrong buy
Neutral
SellBuy
Strong sellStrong buy
Strong sellSellNeutralBuyStrong buy
An aggregate view of professional's ratings.
Neutral
SellBuy
Strong sellStrong buy
Strong sellSellNeutralBuyStrong buy
Neutral
SellBuy
Strong sellStrong buy
Strong sellSellNeutralBuyStrong buy
Neutral
SellBuy
Strong sellStrong buy
Strong sellSellNeutralBuyStrong buy
Displays a symbol's price movements over previous years to identify recurring trends.
Frequently Asked Questions
The current price of METC is 20.30 USD — it has increased by 6.15% in the past 24 hours. Watch Ramaco Resources, Inc. stock price performance more closely on the chart.
Depending on the exchange, the stock ticker may vary. For instance, on NASDAQ exchange Ramaco Resources, Inc. stocks are traded under the ticker METC.
METC stock has risen by 7.03% compared to the previous week, the month change is a 95.52% rise, over the last year Ramaco Resources, Inc. has showed a 75.15% increase.
We've gathered analysts' opinions on Ramaco Resources, Inc. future price: according to them, METC price has a max estimate of 27.00 USD and a min estimate of 14.00 USD. Watch METC chart and read a more detailed Ramaco Resources, Inc. stock forecast: see what analysts think of Ramaco Resources, Inc. and suggest that you do with its stocks.
METC reached its all-time high on Jul 16, 2025 with the price of 24.75 USD, and its all-time low was 1.75 USD and was reached on May 13, 2020. View more price dynamics on METC chart.
See other stocks reaching their highest and lowest prices.
See other stocks reaching their highest and lowest prices.
METC stock is 21.73% volatile and has beta coefficient of −0.02. Track Ramaco Resources, Inc. stock price on the chart and check out the list of the most volatile stocks — is Ramaco Resources, Inc. there?
Today Ramaco Resources, Inc. has the market capitalization of 1.20 B, it has increased by 26.52% over the last week.
Yes, you can track Ramaco Resources, Inc. financials in yearly and quarterly reports right on TradingView.
Ramaco Resources, Inc. is going to release the next earnings report on Nov 11, 2025. Keep track of upcoming events with our Earnings Calendar.
METC earnings for the last quarter are −0.29 USD per share, whereas the estimation was −0.18 USD resulting in a −57.48% surprise. The estimated earnings for the next quarter are −0.15 USD per share. See more details about Ramaco Resources, Inc. earnings.
Ramaco Resources, Inc. revenue for the last quarter amounts to 152.96 M USD, despite the estimated figure of 131.55 M USD. In the next quarter, revenue is expected to reach 156.50 M USD.
METC net income for the last quarter is −13.97 M USD, while the quarter before that showed −9.46 M USD of net income which accounts for −47.76% change. Track more Ramaco Resources, Inc. financial stats to get the full picture.
Yes, METC dividends are paid quarterly. The last dividend per share was 0.14 USD. As of today, Dividend Yield (TTM)% is 1.26%. Tracking Ramaco Resources, Inc. dividends might help you take more informed decisions.
Ramaco Resources, Inc. dividend yield was 4.02% in 2024, and payout ratio reached 197.75%. The year before the numbers were 2.91% and 58.70% correspondingly. See high-dividend stocks and find more opportunities for your portfolio.
As of Aug 6, 2025, the company has 984 employees. See our rating of the largest employees — is Ramaco Resources, Inc. on this list?
EBITDA measures a company's operating performance, its growth signifies an improvement in the efficiency of a company. Ramaco Resources, Inc. EBITDA is 52.74 M USD, and current EBITDA margin is 12.56%. See more stats in Ramaco Resources, Inc. financial statements.
Like other stocks, METC shares are traded on stock exchanges, e.g. Nasdaq, Nyse, Euronext, and the easiest way to buy them is through an online stock broker. To do this, you need to open an account and follow a broker's procedures, then start trading. You can trade Ramaco Resources, Inc. stock right from TradingView charts — choose your broker and connect to your account.
Investing in stocks requires a comprehensive research: you should carefully study all the available data, e.g. company's financials, related news, and its technical analysis. So Ramaco Resources, Inc. technincal analysis shows the neutral today, and its 1 week rating is buy. Since market conditions are prone to changes, it's worth looking a bit further into the future — according to the 1 month rating Ramaco Resources, Inc. stock shows the strong buy signal. See more of Ramaco Resources, Inc. technicals for a more comprehensive analysis.
If you're still not sure, try looking for inspiration in our curated watchlists.
If you're still not sure, try looking for inspiration in our curated watchlists.