MGIC: Backup/ SOS on Wyckoff analysysMGIC: Backup/ SOS on Wyckoff analysys
-Choch accomulation range and Bu/SOS before pumping
-Key level support.
-Demand zone support.
-Logical volumes together with price action.
.
Buy with plans and wait!
See more plans at US STOCKS- WALL STREET DREAM
Next report date
—
Report period
—
EPS estimate
—
Revenue estimate
—
0.77 USD
36.88 M USD
552.52 M USD
25.87 M
About MAGIC
Sector
Industry
CEO
Guy Shimon Bernstein
Website
Headquarters
Or Yehuda
Founded
1983
ISIN
IL0010823123
FIGI
BBG000G4J9J3
Magic Software Enterprises Ltd. operates as a global provider of end-to-end integration and application development platforms solutions and IT consulting services. It operates through the Software Services and Information Technology (IT) Professional Services segments. The Software Services segment includes proprietary and non-proprietary software technology and complementary services. The IT Professional Services segment offers services in infrastructure design and delivery, application development, technology planning and implementation services, communications services and solutions, and supplemental staffing services. The company was founded by David Assia on February 10, 1983 and is headquartered in Or Yehuda, Israel.
Related stocks

Magic Software Enterprises Ltd. $MGICNice upward channel. Just keep adding at key points ala confluence with trendline line, horizontal supports fibs, and pivots. $MAGIC


$MGIC back to OG highs$MGIC -- 11.58 is resistance. Going to be hard to pass back over as that was the top pre corona. All the indicators point to a bearish sentiment for the next few days. Possible to see a right shoulder form for a H/s pattern. (just spit balling) lets see if support of 10.95 holds. If it cannot, $10

MGIC, 50-day MA moved above its 200-day MAA buy signal is generated. I found 5 similar cases where MGIC's 50-day Moving Average crossed above its 200-day Moving Average. In 5 out of 5 cases its price rose further within (more than 4%) during the subsequent month. It means that the odds of a continued Uptrend are 100% but if I give a discoun

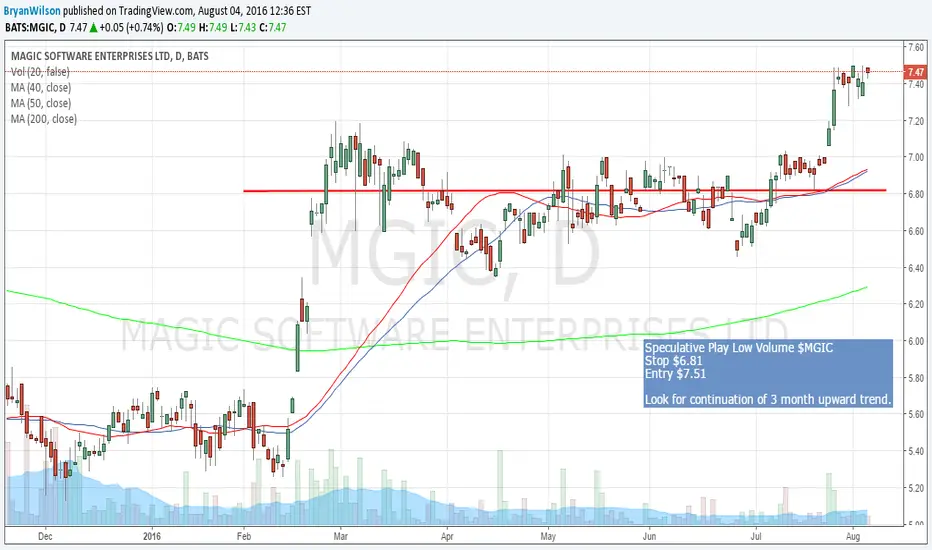
$MGIC 3 Month Trend breakoutI am looking to enter $MGIC a low volume speculative play on the next high around $7.51. I have a stop loss of $6.81 to be set upon entry and hope for continuation of the trend breakout. Volume will make this a tricky position. Stop may not be wide enough, but based on the 20 Day ATR it looks to
See all ideas
Summarizing what the indicators are suggesting.
Neutral
SellBuy
Strong sellStrong buy
Strong sellSellNeutralBuyStrong buy
Neutral
SellBuy
Strong sellStrong buy
Strong sellSellNeutralBuyStrong buy
Neutral
SellBuy
Strong sellStrong buy
Strong sellSellNeutralBuyStrong buy
An aggregate view of professional's ratings.
Neutral
SellBuy
Strong sellStrong buy
Strong sellSellNeutralBuyStrong buy
Neutral
SellBuy
Strong sellStrong buy
Strong sellSellNeutralBuyStrong buy
Neutral
SellBuy
Strong sellStrong buy
Strong sellSellNeutralBuyStrong buy
Displays a symbol's price movements over previous years to identify recurring trends.
Frequently Asked Questions
The current price of MGIC is 20.74 USD — it has decreased by −3.35% in the past 24 hours. Watch Magic Software Enterprises Ltd. stock price performance more closely on the chart.
Depending on the exchange, the stock ticker may vary. For instance, on NASDAQ exchange Magic Software Enterprises Ltd. stocks are traded under the ticker MGIC.
MGIC stock has fallen by −0.34% compared to the previous week, the month change is a 37.05% rise, over the last year Magic Software Enterprises Ltd. has showed a 89.23% increase.
We've gathered analysts' opinions on Magic Software Enterprises Ltd. future price: according to them, MGIC price has a max estimate of 16.00 USD and a min estimate of 16.00 USD. Watch MGIC chart and read a more detailed Magic Software Enterprises Ltd. stock forecast: see what analysts think of Magic Software Enterprises Ltd. and suggest that you do with its stocks.
MGIC reached its all-time high on Feb 17, 2000 with the price of 33.00 USD, and its all-time low was 0.65 USD and was reached on Oct 13, 1998. View more price dynamics on MGIC chart.
See other stocks reaching their highest and lowest prices.
See other stocks reaching their highest and lowest prices.
MGIC stock is 3.57% volatile and has beta coefficient of 0.76. Track Magic Software Enterprises Ltd. stock price on the chart and check out the list of the most volatile stocks — is Magic Software Enterprises Ltd. there?
Today Magic Software Enterprises Ltd. has the market capitalization of 1.05 B, it has increased by 0.34% over the last week.
Yes, you can track Magic Software Enterprises Ltd. financials in yearly and quarterly reports right on TradingView.
Magic Software Enterprises Ltd. is going to release the next earnings report on Aug 13, 2025. Keep track of upcoming events with our Earnings Calendar.
MGIC earnings for the last quarter are 0.25 USD per share, whereas the estimation was 0.27 USD resulting in a −7.41% surprise. The estimated earnings for the next quarter are 0.25 USD per share. See more details about Magic Software Enterprises Ltd. earnings.
Magic Software Enterprises Ltd. revenue for the last quarter amounts to 147.34 M USD, despite the estimated figure of 143.79 M USD. In the next quarter, revenue is expected to reach 143.06 M USD.
MGIC net income for the last quarter is 9.48 M USD, while the quarter before that showed 10.62 M USD of net income which accounts for −10.77% change. Track more Magic Software Enterprises Ltd. financial stats to get the full picture.
Yes, MGIC dividends are paid semi-annually. The last dividend per share was 0.33 USD. As of today, Dividend Yield (TTM)% is 2.62%. Tracking Magic Software Enterprises Ltd. dividends might help you take more informed decisions.
Magic Software Enterprises Ltd. dividend yield was 3.66% in 2024, and payout ratio reached 58.57%. The year before the numbers were 6.47% and 83.12% correspondingly. See high-dividend stocks and find more opportunities for your portfolio.
As of Jul 14, 2025, the company has 3.79 K employees. See our rating of the largest employees — is Magic Software Enterprises Ltd. on this list?
EBITDA measures a company's operating performance, its growth signifies an improvement in the efficiency of a company. Magic Software Enterprises Ltd. EBITDA is 84.04 M USD, and current EBITDA margin is 14.69%. See more stats in Magic Software Enterprises Ltd. financial statements.
Like other stocks, MGIC shares are traded on stock exchanges, e.g. Nasdaq, Nyse, Euronext, and the easiest way to buy them is through an online stock broker. To do this, you need to open an account and follow a broker's procedures, then start trading. You can trade Magic Software Enterprises Ltd. stock right from TradingView charts — choose your broker and connect to your account.
Investing in stocks requires a comprehensive research: you should carefully study all the available data, e.g. company's financials, related news, and its technical analysis. So Magic Software Enterprises Ltd. technincal analysis shows the buy rating today, and its 1 week rating is buy. Since market conditions are prone to changes, it's worth looking a bit further into the future — according to the 1 month rating Magic Software Enterprises Ltd. stock shows the strong buy signal. See more of Magic Software Enterprises Ltd. technicals for a more comprehensive analysis.
If you're still not sure, try looking for inspiration in our curated watchlists.
If you're still not sure, try looking for inspiration in our curated watchlists.