MNKD trade ideas


MNKD 1D ASCENDING TRIANGLE BREAKOUT LONGAscending Triangles are repeatable trading chart patterns.
Ascending chart patterns will have a directional bias depending on the previous incoming trend.
Each chart pattern will have defining trendlines of the support/resistance levels creating the pattern.
What ever time frame you are trading this chart pattern, wait for a candle close outside of the trendline in the direction of the breakout candle. (Our time frame preference is the Daily chart).
Add volume indicator - Volume is the amount of $ that went into a particular candle or in Forex the # of trades that took place.
Add ATR indicator - Volatility is the amount of price movement that occurred. Use the ATR to measure the price movement.
When you see descending Volume bars and descending ATR line (which indicates volatility) this shows
a dis-interest in traders to invest in this pair creating consolidation which creates the chart pattern.
Trade Management after there is a breakout candle close.
1 - Position size (compare volume bar to volume ma line).
a - Breakout candle must be 100% of volume average for a full position size.
b - If 75% of volume average then ½ position size. (To find 75% of Volume
look at the charts volume settings – divide smaller # into larger # = 75%+)
If not 75% then stand aside from the trade.
2 – If candle breaks out of a trendline, 15m before the close of the day prepare your buy/sell order.
Enter two trades. 1st trade will have a SL & TP. It will close automatically when the 1st TP is hit. 2nd
trade only has a SL and will be allowed to run. When 1st TP is hit move the SL to breakeven. Look
at ATR and prepare SL at 1.5 of ATR. Prepare 1st trade TP at 1 of ATR.
3 - SL for both trades will be 1.5 x ATR.
4 - 1st trade TP will be 1 x ATR.
5 - No TP on 2nd trade – letting profit run and adjusting SL to follow price.
6 - When 1st TP hit – move 2nd trade SL to breakeven.
7 - Adjust the 2nd trade SL to follow price.
*8 – After Breakout candle – if price closes back into chart pattern close trade don't wait for SL to be hit.
*9 - When breakout candle is more than 1 ATR from breakout candle open.
a - Enter 1st trade at candle close with ½ position size.
b - Enter 2nd trade with a pending limit order that is 1 ATR of breakout candle open.
c – Price should pullback to that pending limit order for 2nd trade.
d – If Price returns back into chart pattern close trade before SL is hit.


$MNKD Mankind Corp $2.65 target MannKind Corp. is a biopharmaceutical company. It focuses on the discovery, development and, commercialization of therapeutic products for diseases, such as diabetes and cancer. The company was founded by Alfred E. Mann on February 14, 1991 and is headquartered in Westlake Village, CA.


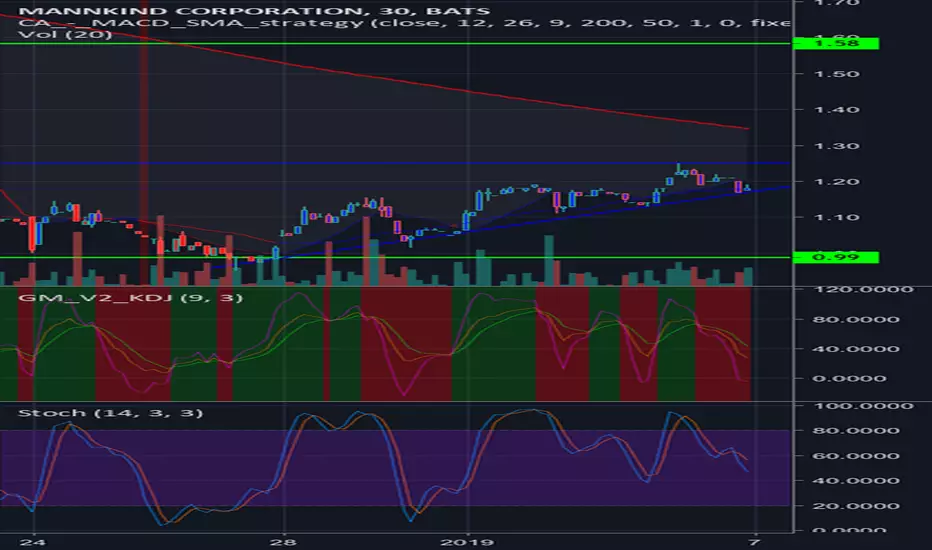
The baggy dead stock bounce strategy: Another exampleI know nothing of this company. But either way, looks like a nice example of buying something beaten up down 99% after it starts rallying.
When it goes down usually it goes down pretty fast (crypto won't be an exception btw), important not to overstay your welcome.
I do not use this strategy at all. Adding an example, learning a bit more every few month or so... learn with me.
If it goes to zero it is fine since this strategy aims for several hundred percent returns often. No need to go all in...
Here we can see that we have a V shape reversal at the bottom, a ~50% retrace, then a C wave very extended.
The ABC retraced ~50% ~55%.
In the case of cryptocurrencies...
They retraced 55%, from being down 92%, but this does not look like we are "at the bottom", they are still way up from where they started.
Bitcoin retraced 78.6%. I am not sure the strategy is the same... Will see how this progresses.
If BTC gets to a few dollars, it can go up thousands of percents... But who will get filled?
Oh companies on the verge of bankrupcy can recover... You will never believe what company did this... (if you do not already know)...
APPLE.
In 1997 they were about to go bust and Microsoft threw 150 million in and saved them. Now Apple is pretty big (in a bubble thought).
99% or more companies just disappear cannot even find them on trading view whick makes it hard to analyse this strategy here.
Kodak went bankrupt in 2012 and re-emerged in 2013:
The "new" Kodak fell by more than 90% lmao. Not sure how much the previous one fell.
In 96 the price was above 90$ and at the end it was circling around 5.
They had a nice back to normal.
The new company price does not pick up the old one. The probably issued less shares to make it look like they bounced back.
If I look at the daily chart:
That is just too fast.
I also noticed something else. That I am keeping for myself. Sry. Rekt.
Looking at more examples will help. Maybe a good new strategy in the future here?
The point of having multiple strategy is more a safeguard if the ones being used stop working rather than to make more money or to diversify.
One question remains: Where do all these poop chasing baggies come from? And why do they keep appearing?

MNKD - Slow, Steady, BullishMNKD is on a slow bullish trend.
weekly, daily, and hourly bullish trend
may retrace to support at $1.18 based on daily RSI, but will likely continue to rise
support/entry: $1.18
target: is $2.20
stop $1.10


Longthe 200 day ema has cut thru the Bollinger bands, and for some reason, price seems to spike after this action. Price is closing in on the 200 day ema which should push this stock into bullish mode. Wedge patter is close to completion.


MNKD - Next Resistance Level 1.5, or Reversal of DownTrendLooking for a resistance level that causes a reversal of trend. You can see the 2.01 resistance level was hit on 9/6, and 9/7 the price fell through to 1.78. If the downward trend continues, the next resistance level to be hit would be 1.5. Substantial sell volume on 9/5, 9/6 and 9/7 could be indicative of a higher likelihood for a trend reversal early next week.
According to Chris Lau at InvestorPlace, a 10 yr discounted cash flow revenue exit model values shares at an average of $2.40, placing the stock at a current discount of 20/25%, assuming revenue increases due to the new partnership with UTHR.
finance.yahoo.com

Stock price actually testing a major support of $2.01It could bounce on this level to get uptrend again.
Or it could get under this level and go down to the next support.

$MNKD Spiked$MNKD spiked on good news yesterday ( Holiday)
And could continue on good news.
(And alot of BIG insiders buying this!)

MNKD - swing for the weekMNKD had a volume surge on Friday after some positive results were shown.
ADX is still flat which is currently over 10 +DMI is over 17 and -DMI is over 16. It closed over the 50 day moving average which is currently at 1.8.
Entry would be 1.75/1.81/1.87/1.91
Pivot is 1.97
Resistance is 2.03/2.07/2.013/2.23
For me I would look to enter this from 1.81 to 1.87 stop loss will be 10 cents under my bid. Currently this is over the pivot of 1.97 so look to see for a continuation if my bid does not get filled.

MNKD trying to make a major push up. Technically speacking it is getting squeezed in a wedge. The move could be up since last earning were not half bad, they were actually pretty good, I am surprized that the move hasn't happened yet.
