MSFT getting ready for a bounce ahead of earningsWith a nice pullback today, I am hoping it pulls back a little more at market open to $351.43 before its continuation back up. Although, it is currently respecting its 1H 21MA around $352, so just keep an eye on it if it breaks below next support will be the $351.43.
I can see it retesting $360 next week before earnings on Tuesday 7/25 AH.
MSFT trade ideas

Microsoft Long Alltime High hit Earnings New 52-week highs this week, powered by the Dow which, on Friday, extended its streak of positive days to ten — something the blue chip index has not done in almost six years. The Dow has been powered by, among other things, a slew of corporate financial results, particularly from the banks, which showed not only improved profitability, but also strong guidance for the next quarter and full year.
I have explained 2 bullish scenarios,1 bearish(worse case).
Bullish:
higher highs higher lows
poc uprising
volume increasing
capital flow rising
In case the Take profits hit, and we have increased volume, I will ride the trend.
I will only take profit 10% of the microsoft portfolio and let the profit run.
Exit :Stop loss or trend change signal
The mid and long term horizon is bullish. If any Profit taking level reaches, and trend continuation is signalizing that the uptrend will be continued, I will increase agressively my positions and take only 10% profits of each position.I will let the prfoits run.
This trade setup is only for trend followers and on daily TF.

MSFTRetracement time on MSFT in my opinion.
Once we break this nasty looking flag we'd possibly see downside all the way to 300 and 270.

MSFT Microsoft Options Ahead of Earnings ! Growth Thesis !If you haven`t bought MSFT when they Bought 49% Stake in OpenAI, creator of ChatGPT:
Or sold on their warning to investors:
Then analyzing the options chain and chart patterns of MSFT Microsoft prior to the earnings report this week,
I would consider purchasing the 345usd strike price Calls with
an expiration date of 2024-1-19,
for a premium of approximately $28.95.
If these options prove to be profitable prior to the earnings release, I would sell at least half of them.
The investment by Microsoft in OpenAI signifies a significant boost to their artificial intelligence capabilities. OpenAI's advanced technologies and expertise in AI research and development could potentially enhance the capabilities of Microsoft's Bing search engine. With access to powerful AI algorithms and resources, Bing may be able to offer more personalized and accurate search results, thereby attracting users who seek a more refined search experience.
Microsoft has been making strategic moves to expand its presence in various sectors, including cloud computing and enterprise services. By integrating Bing into its ecosystem of products and services, Microsoft can leverage its existing user base and partnerships to promote Bing as a viable alternative to Google.
In recent years, Google has faced scrutiny over data privacy concerns and antitrust issues, which could create an opportunity for Bing to gain traction among users seeking more privacy-focused alternatives. Additionally, Microsoft has been actively investing in marketing and advertising efforts to raise awareness about Bing and improve its market positioning.
While Google currently holds a dominant position in the search engine market, the landscape is dynamic and subject to change. If Microsoft successfully leverages its partnership with OpenAI to enhance Bing's capabilities, coupled with strategic marketing initiatives, it could potentially chip away at Google's market share over time.
The implementation, by Microsoft, of a chatbot like ChatGPT, powered by OpenAI's advanced natural language processing capabilities, could indeed provide an opportunity for consumers to find the cheapest price online for the same product. In an era where price comparison and cost-saving measures are highly valued by customers, this feature could be a valuable asset for Bing.
Amazon's reputation for having expensive and overvalued prices has been a topic of discussion among consumers. While Amazon provides a wide range of products and convenient shopping experiences, some users have expressed concerns about the pricing competitiveness on the platform. This presents an opening for Bing to attract cost-conscious consumers who are actively seeking better deals.
The concern over the origin of products, particularly those manufactured in China, has gained attention in recent years. Some consumers prefer to avoid purchasing Chinese-made products due to quality, safety, or political reasons. If Bing can provide a search experience that allows users to filter or identify the origin of products more effectively, it could cater to a segment of consumers who prioritize alternative sourcing.
I think MSFT will be one of the winners of the AI race.
Looking forward to read your opinion about it.

MSFT -- Long IdeaLooking to see what happens with MSFT at trend line
looking for option with minimal risk and solid reward

MSFT suppressed by the 3.000 level of the golden sectionMSFT suppressed by the 3.000 level of the golden section
This chart shows the weekly candle chart of Microsoft stock in the past two years. The graph overlays the low point at the end of October 2022 against the golden section. As shown in the figure, Microsoft's stock has reached another new high this week, breaking through the highest point at the end of 2021! But the weekly pattern of Microsoft stock this week is a long shadow line, with the highest point precisely suppressed by the 3.000 level of the golden section in the figure! Based on last week's weekly pattern, Microsoft's stock market is likely to enter a contraction triangle consolidation state in the future!

Is MSFT's bullish momentum depleted?
The uptrend channel
A 100% parallel extension of the uptrend channel indicates the strength of this bullish trend.
Symmetrical projection: An uptrend N pattern
By projecting a 100% symmetry projection of the initial swing from point A to B, and extending it from point C, the target price would be point D at $303.3.
Given that the anticipated symmetric pullback to point E did not occur, my expectation is for a further 100% extension from point D. As a result, the target price has been revised upwards to point F at $360.8.
Other key levels
Resistance
The historical highest high at $349.6 is a very strong resistance level, coinciding with the upper band of the channel's 100% extension. The more resistances encountered, the harder it is to break through.
Support
The 1.5 extension level at $ 332 is a support level that has been tested. Clear price reactions to key Fibonacci levels can enhance the overall significance and value of the analysis.
The prior low level, which is at $322.5, can always act as a significant support level. Moreover, it’s a resistance turned support level, making it more important.
Possible scenarios
If the uptrend continues…
When facing the key resistance at $349.6, the market should exhibit a clear movement, like a gap-up opening or a significant bullish candle, to demonstrate its determination.
If the bullish momentum is depleted…
The market is likely to pull back the price to below the prior low level, which is at $322.5.
Compared to the 1.5 extension support level, the level of the prior low holds greater importance. If the 1.5 extension support level is breached, it serves as a mere warning. However, If the level of the prior low is breached, it disrupts the rhythm of a healthy bullish trend and makes price movements difficult to anticipate.
Conclusion
If the key support at $322.5 is breached, it’s better to step out of the market. Allow the market to stabilize on its own, and wait for a clearer signal before reentering.
If not, the uptrend will continue, and the target price remains at $360.8.
Hindsight bias part
While our target price is $360.8, the prior historical high level at $349.6 represents the optimal target price. Considering the formidable resistance at the prior historical high, I prefer to sacrifice a small portion of potential returns in favor of a higher probability of success.
**Not Financial Advice**
The information contained in this article is not intended as, and should not be understood as financial advice. You should take independent financial advice from a professional who is aware of the facts and circumstances of your individual situation.

MSFT | Elliot Waves TANASDAQ:MSFT
Here is TA based on EW, I have no idea it will work or not, I never use EW as my trading strategy, but it's good to have an idea based on it, if it works then we should expect at ATH.

MSFT AnalysisPrice fails to mitigate the bullish POI at 322.72 again, took liquidity at 328.49 and broke market structure to the upside, giving us a 10.32% move to the upside. Right now, I'm expecting a bearish retracement and price to follow the bullish order flow.

Adding long on Microsoft shares We can see it has broke out of the bearish trend line after witnessing a nice support at 281 level. The sharp tail end of the candle on 24 Jan was to weed out the weak buyers so that big boys can start accumulating and push it higher again.

MSFT RecapThis is how I capitalized on MSFT Calls today. Building Block was working up a big move and was able to use intermediate structure, with some special concepts I have up my sleeve for the benefit. This was a very good move to the upside.

Cup & Handle $MSFTNASDAQ:MSFT Just made a double top, in my opinion there is no reason for a down move, just a quick consolidation till the next move.
Cup & Handle will come next into earnings.


Part two of 7 Mega Cap tech stocks QQQ SPY- follow the trend on these stocks, there will be a time to short when we see daily downtrend confirming
- FIRST STEP for bears is we need a hourly downtrend for anything to really happen
- As of now all mega tech are still healthy

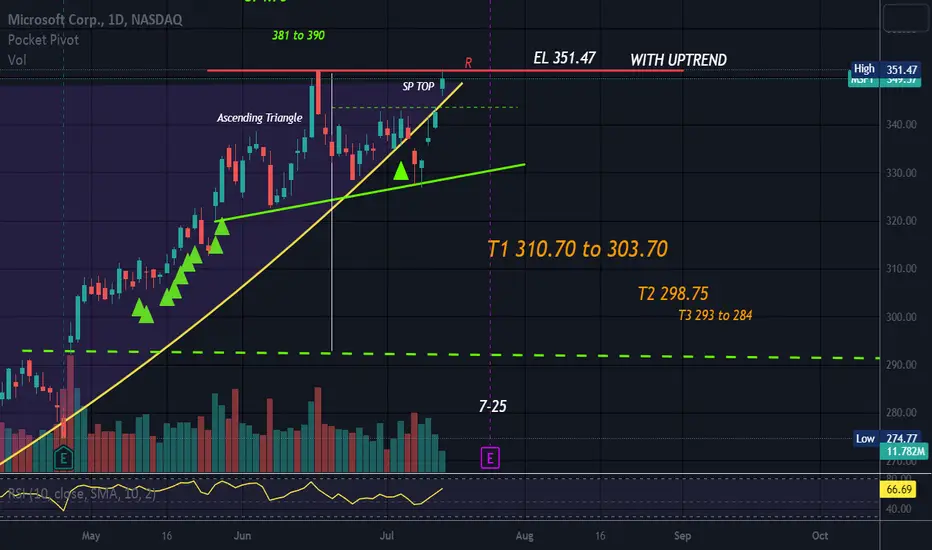
Ascending TriangleMSFT has been banging away at the resistance line of a large Cup & Handle pattern and has possibly moved the resistance line to 351.47 after a few attempts at this almost exact level.
This was looking toppy, but another leg up has changed that outlook, for now.
This stock is trying to beat an ATH, so price is making it's own resistance at an unusual level as it seems to have trouble getting past 351.47. There is no old price action above 351.47.
Often with almost no resistance overhead a stock will fly in to the sky for a while at least.
Strong stock. Earnings are fairly soon/7-27/and could explain the hesitancy.
Spinning top at resistance today/indecision.
This level is supposed to be a launching pad, not a camping ground. (o:
No recommendation
Long MSFTmacro: snp500 QQQ uptrend
News: inflation flattening
TA : Break of tight range, and bouncing off 25ema
STOP: rolling till worthless options
TP: low value per day or expire
risk: earnings on 25th july
