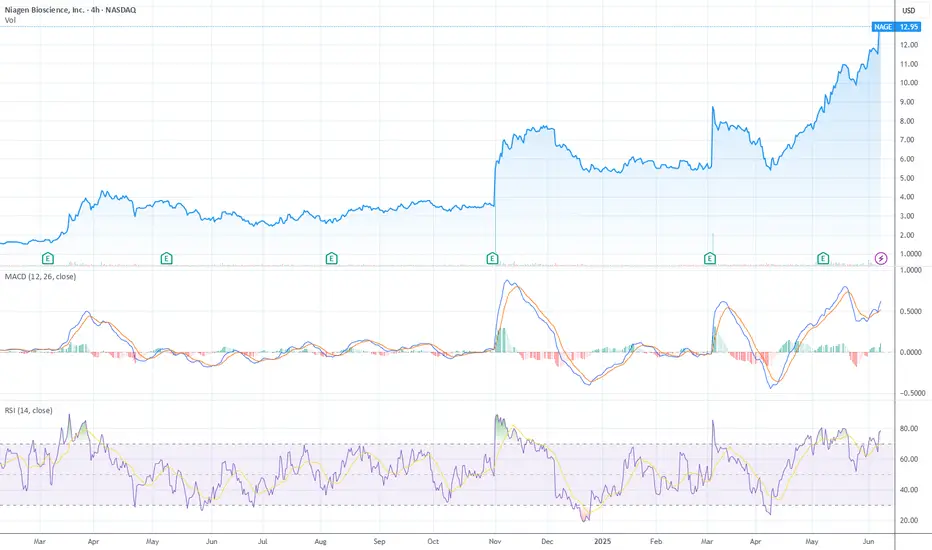
Niagen Breaks Out: Eyes on $15–17 as Momentum TargetsNiagen Bioscience ( NASDAQ:NAGE ) is in vertical price discovery mode, pushing into new highs with strong trend momentum, but with RSI at 78.66 and a flattening MACD histogram, it’s nearing a classic short-term exhaustion zone
Technical Breakdown
1. Price Action – Parabolic Advance
Price is cli
Next report date
—
Report period
—
EPS estimate
—
Revenue estimate
—
0.18 USD
8.55 M USD
99.60 M USD
49.81 M
About Niagen Bioscience, Inc.
Sector
Industry
CEO
Robert N. Fried
Website
Headquarters
Los Angeles
Founded
1999
FIGI
BBG000BG1J71
Niagen Bioscience, Inc. is a global bioscience company, which engages in acquiring, developing, and commercializing proprietary-based ingredient technologies. It is pioneering research on nicotinamide adenine dinucleotide (NAD+). The company’s patent portfolio includes Nicotinamide Riboside (NR) and other NAD+ precursors, which are commercialized as the flagship ingredient Niagen. It operates through the following segments: Consumer Products, Ingredients, and Analytical Reference Standards and Services. The Consumer Products segment provides finished dietary supplement products that contain the firm’s proprietary ingredients directly to consumers as well as to distributors. The Ingredients segment supplies ingredients as raw materials to the manufacturers of consumer products. The Analytical Reference Standards and Services segment includes supply of phytochemical reference standards and other research and development services. The company was founded by Mark S. Germain and Frank L. Jaksch, Jr. in 1999 and is headquartered in Los Angeles, CA.
Related stocks

Summarizing what the indicators are suggesting.
Neutral
SellBuy
Strong sellStrong buy
Strong sellSellNeutralBuyStrong buy
Neutral
SellBuy
Strong sellStrong buy
Strong sellSellNeutralBuyStrong buy
Neutral
SellBuy
Strong sellStrong buy
Strong sellSellNeutralBuyStrong buy
An aggregate view of professional's ratings.
Neutral
SellBuy
Strong sellStrong buy
Strong sellSellNeutralBuyStrong buy
Neutral
SellBuy
Strong sellStrong buy
Strong sellSellNeutralBuyStrong buy
Neutral
SellBuy
Strong sellStrong buy
Strong sellSellNeutralBuyStrong buy
Displays a symbol's price movements over previous years to identify recurring trends.
Frequently Asked Questions
The current price of NAGE is 9.66 USD — it has increased by 3.97% in the past 24 hours. Watch Niagen Bioscience, Inc. stock price performance more closely on the chart.
Depending on the exchange, the stock ticker may vary. For instance, on NASDAQ exchange Niagen Bioscience, Inc. stocks are traded under the ticker NAGE.
NAGE stock has fallen by −5.00% compared to the previous week, the month change is a −29.83% fall, over the last year Niagen Bioscience, Inc. has showed a 214.66% increase.
We've gathered analysts' opinions on Niagen Bioscience, Inc. future price: according to them, NAGE price has a max estimate of 23.00 USD and a min estimate of 9.60 USD. Watch NAGE chart and read a more detailed Niagen Bioscience, Inc. stock forecast: see what analysts think of Niagen Bioscience, Inc. and suggest that you do with its stocks.
NAGE reached its all-time high on Sep 3, 2008 with the price of 45.01 USD, and its all-time low was 0.99 USD and was reached on Aug 3, 2009. View more price dynamics on NAGE chart.
See other stocks reaching their highest and lowest prices.
See other stocks reaching their highest and lowest prices.
NAGE stock is 2.93% volatile and has beta coefficient of 1.10. Track Niagen Bioscience, Inc. stock price on the chart and check out the list of the most volatile stocks — is Niagen Bioscience, Inc. there?
Today Niagen Bioscience, Inc. has the market capitalization of 763.28 M, it has decreased by −2.46% over the last week.
Yes, you can track Niagen Bioscience, Inc. financials in yearly and quarterly reports right on TradingView.
Niagen Bioscience, Inc. is going to release the next earnings report on Aug 6, 2025. Keep track of upcoming events with our Earnings Calendar.
NAGE earnings for the last quarter are 0.07 USD per share, whereas the estimation was 0.02 USD resulting in a 264.58% surprise. The estimated earnings for the next quarter are 0.01 USD per share. See more details about Niagen Bioscience, Inc. earnings.
Niagen Bioscience, Inc. revenue for the last quarter amounts to 30.48 M USD, despite the estimated figure of 27.07 M USD. In the next quarter, revenue is expected to reach 28.36 M USD.
NAGE net income for the last quarter is 5.06 M USD, while the quarter before that showed 7.18 M USD of net income which accounts for −29.47% change. Track more Niagen Bioscience, Inc. financial stats to get the full picture.
No, NAGE doesn't pay any dividends to its shareholders. But don't worry, we've prepared a list of high-dividend stocks for you.
As of Jul 30, 2025, the company has 104 employees. See our rating of the largest employees — is Niagen Bioscience, Inc. on this list?
EBITDA measures a company's operating performance, its growth signifies an improvement in the efficiency of a company. Niagen Bioscience, Inc. EBITDA is 16.62 M USD, and current EBITDA margin is 9.25%. See more stats in Niagen Bioscience, Inc. financial statements.
Like other stocks, NAGE shares are traded on stock exchanges, e.g. Nasdaq, Nyse, Euronext, and the easiest way to buy them is through an online stock broker. To do this, you need to open an account and follow a broker's procedures, then start trading. You can trade Niagen Bioscience, Inc. stock right from TradingView charts — choose your broker and connect to your account.
Investing in stocks requires a comprehensive research: you should carefully study all the available data, e.g. company's financials, related news, and its technical analysis. So Niagen Bioscience, Inc. technincal analysis shows the sell today, and its 1 week rating is buy. Since market conditions are prone to changes, it's worth looking a bit further into the future — according to the 1 month rating Niagen Bioscience, Inc. stock shows the buy signal. See more of Niagen Bioscience, Inc. technicals for a more comprehensive analysis.
If you're still not sure, try looking for inspiration in our curated watchlists.
If you're still not sure, try looking for inspiration in our curated watchlists.