USTEC 1H – Dual Entry Precision | TCB Trend Phase SetupUSTEC 1H – Dual Entry Precision | TCB Trend Phase Setup
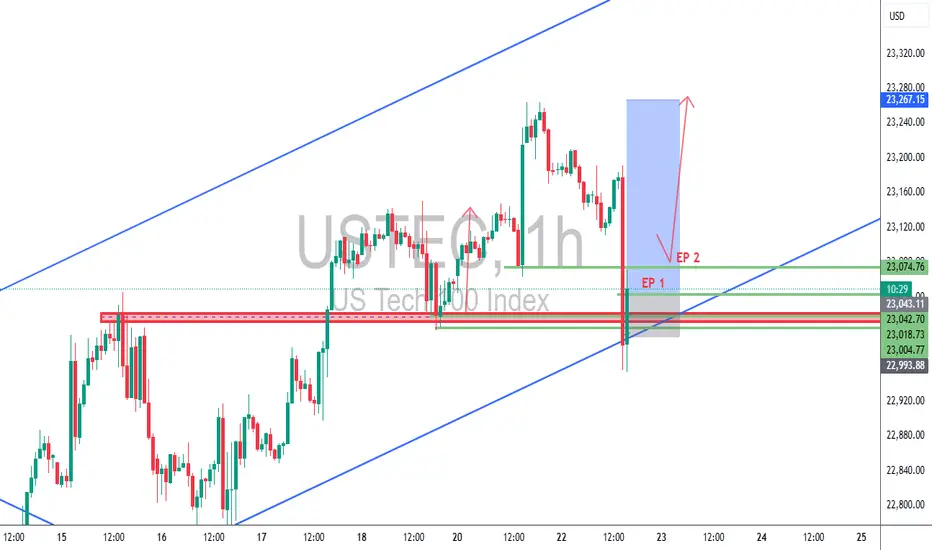
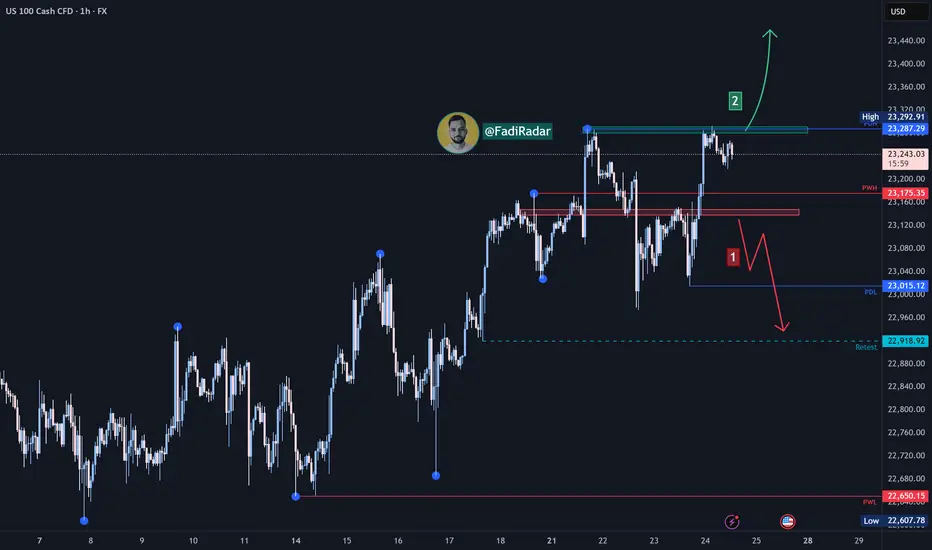
Market remained bullish with clear channel structure. After a pullback into the previous breakout zone, price swept liquidity and wicked below, offering two refined entries (EP 1 & EP 2) inside the demand zone.
🔸 EP 1 – Aggressive entry on first touch
🔸 EP 2 – Confirmation entry after rejection
🔸 SL placed below structural liquidity sweep
🔸 Target: Mid-channel + price inefficiency fill above
Trade Summary
🧠 Trend Phase entry with TCB logic
📌 Demand zone = Key structure
⏱️ Low drawdown
💥 RRR ~1:3
📈 TP in motion (or hit, if price reached 23,267)
📎 #Hashtags:
#USTEC #US100 #Nasdaq #SmartMoneyConcepts #SniperTrader #ForexTrading #PriceActionTrading #TCBSetup #TrendTrading #LiquiditySweep #RiskReward #TradingViewAnalysis
NDX trade ideas
NAS100 (LONG IDEA)🟦 NAS100 (US Tech 100) – LONG SETUP 🟦
📅 Posted: 24 July 2025
🚦 Bias: BULLISH (Long)
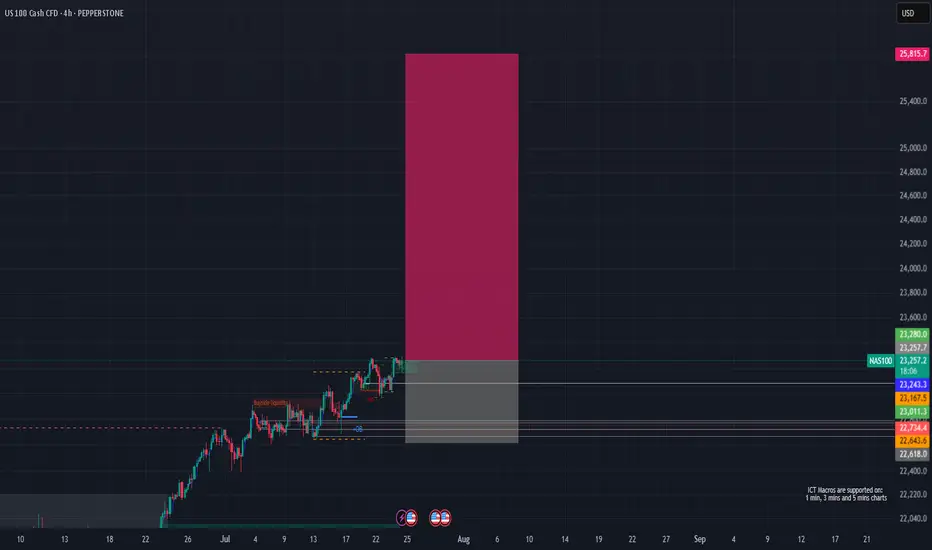
🎯 Entry: 23,262 (market) or 23,170–23,250 (limit on dip)
🛑 Stop Loss: 22,617 (HTF structure protection)
🏁 Take Profits:
• TP1: 23,800
• TP2: 24,500
• TP3: 25,800
🔍 Technical Breakdown:
📈 Multi-Timeframe Confluence:
Monthly/Weekly/Daily: All show strong bullish structure, with price making new highs and respecting key demand zones.
4H/1H: Price is consolidating above a Fair Value Gap (FVG) at 23,170–23,250, showing strong demand and absorption.
🟩 FVG Support: 23,170–23,250 is the high-probability dip buy zone, aligning across all timeframes.
🟦 Structure: Higher highs and higher lows, with no signs of exhaustion.
🟢 Momentum: Bullish, with buyers stepping in on every dip.
🛡️ Invalidation: Clean break and close below 22,730 would invalidate the setup.
🔥 Fundamental & Sentiment Context:
💻 Tech/AI Leadership: US tech and AI stocks are driving index strength.
💵 Earnings Momentum: Strong earnings season, macro resilience.
🧑💻 Sentiment: Retail is long but not euphoric; institutions still net buyers.
🌍 Macro: No major headwinds; risk-on flows support further upside.
🛠️ Execution Plan:
💸 Buy now @ 23,262 or scale in on dips to 23,170–23,250 (FVG retest).
🛡️ Stop Loss: 22,617 (structure break).
🎯 Targets:
TP1: 23,800 (first liquidity target)
TP2: 24,500 (extension)
TP3: 25,800 (ATH zone)
⚡ Summary:
All signals GO! 🚦 Multi-timeframe bullish structure, FVG support, and strong momentum. Risk is well-defined below 22,730. Targeting new highs as tech/AI leadership continues.
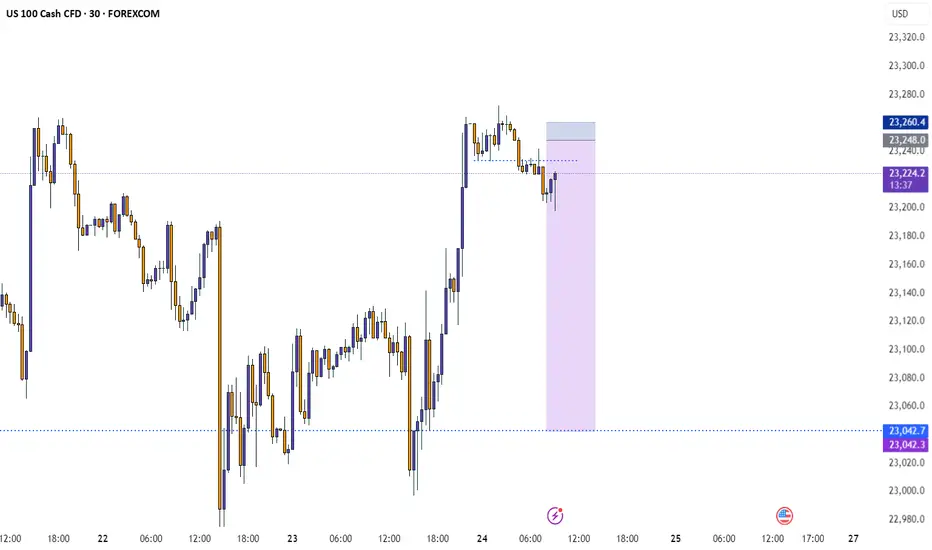
NAS100 ShortSecond entry same area to enter
Elite Analysis
Price came to structural liquidity
Targeted a 5m OB for execution
TP's targeted at lower liquidity pools

USNAS100 - Tech Index Pulls Back After Testing 23,295USNAS100 | OVERVIEW
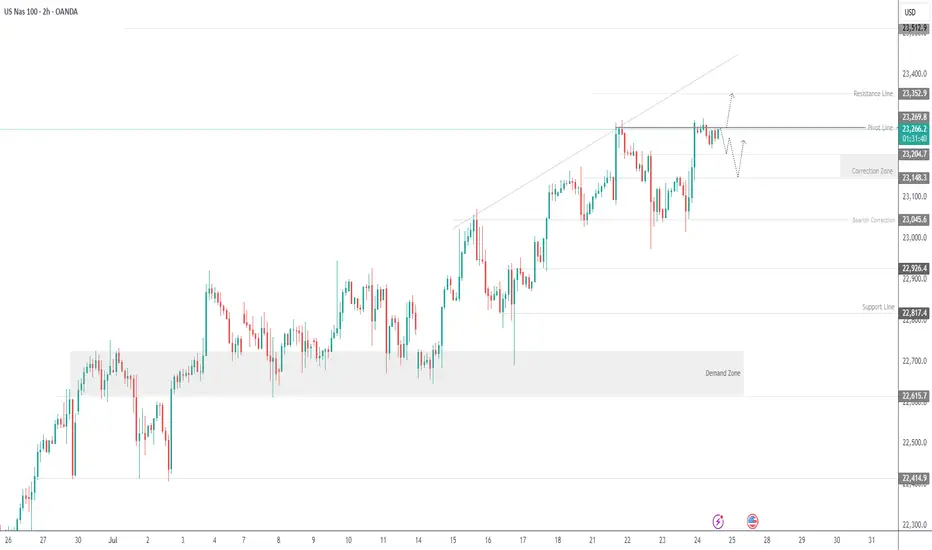
The index came close to registering a new ATH at 23,295 before pulling back slightly.
Today, it appears to be in a bearish correction phase toward 23,200 and 23,150, as long as the price trades below 23,270.
Market sentiment may remain cautious, especially with no major earnings reports scheduled before the open, although Intel’s report after the close could have a notable impact.
A 1H close above 23,290 would invalidate the correction and open the way toward 23,350 and 23,500.
Key Levels:
Support: 23,200 · 23,150 · 23,050
Resistance: 23,350 · 23,520
Nasdaq Index Analysis (US100 / NASDAQ):The Nasdaq index continues its upward trend in the medium to long term. Yesterday, it tested the 23,000 USD level and bounced higher toward 23,290 USD.
1️⃣ If the price breaks below 23,100 USD and closes beneath it, we may see a decline toward 23,000 USD, followed by 22,920 USD.
2️⃣ However, if the price holds above 23,290 USD, further bullish momentum could lead to a new high around 23,400 USD.
⚠️ Disclaimer:
This analysis is not financial advice. Please monitor the markets and analyze the data carefully before making any investment decisions.
SellRejection Level
Daily Volume
Market Structure Shift
London Session
Trend Line Break
Untapped Order Point
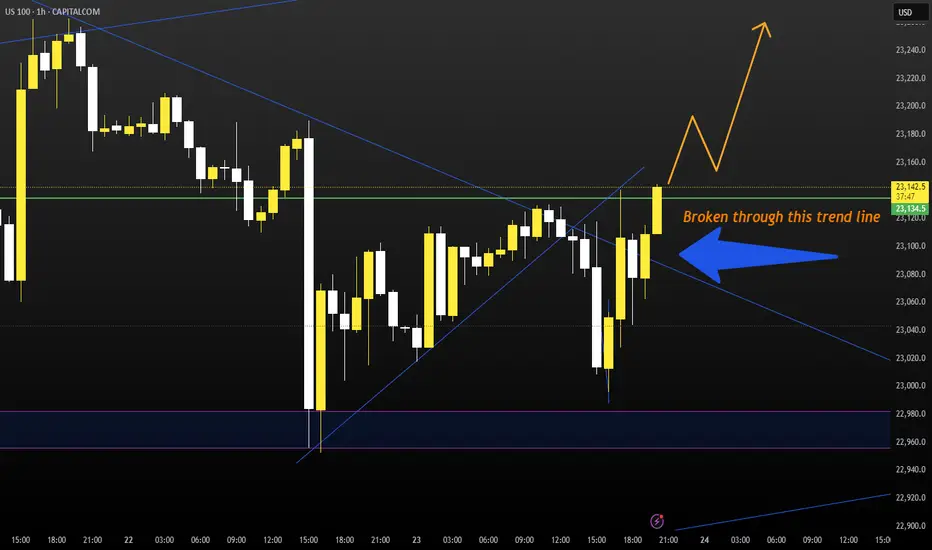
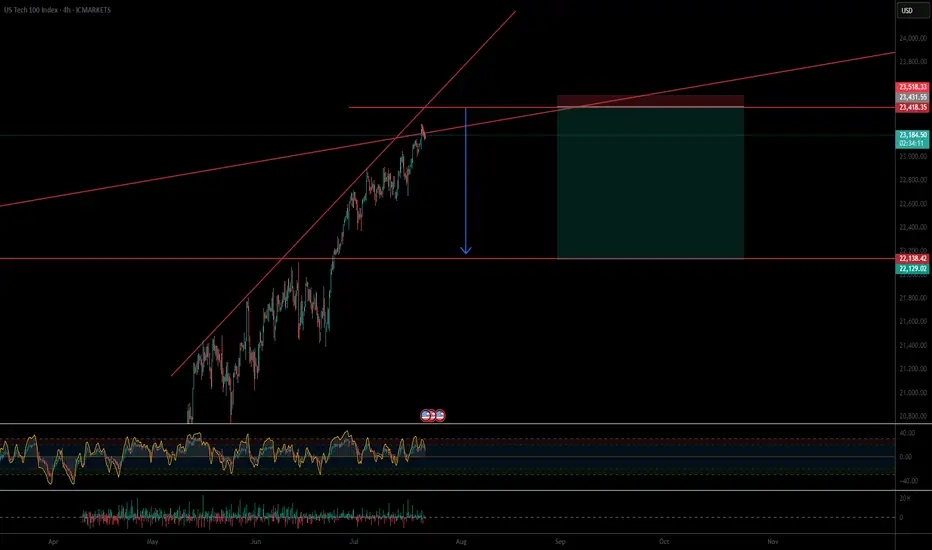
Nasdaq Ascending Trend has been broken.Good night traders.
With Tuesday & today's move. NQ has broken the ascending trend, and retested the highs.
A total of 107 daily candles, 7,000pips move.
Reasons for taking this trade:
Current monthly candle has 2.9m volume, compared to a 6m & 7million from last 2 months. With only 8 days missing to end the month, how to fill all that pending volume?
Ascending trend has been broken and retested.
Expect a deep correction, around 2000-2400-2600 pips. There is correlation between 38.2 Fibo level.
Last week there was a manipulation with Powell dismiss rumor on Wednesday, next day on Thursday NQ rallied to the upside. Today being also Wednesday we saw a huge rejection to the upside, but there is no continuation.
DXY reaching bottom, + has a deeper short trend initiation, starting on January 13.
Trade will be validated if NQ creates a LL followed by a LH within the next 2 days.
What do you think of this analysis?
Thank you.
Enjoy

NASDAQ Rebounding on its 1H MA50.Nasdaq (NDX) rebounded today on its 1H MA50 (blue trend-line), third time since Friday's and Thursday's bounce. A Channel Up is emerging and based on the 4H RSI it is a medium-term bullish reversal off the Pivot trend-line, similar to June 20 - 30.
As you can see, that Channel Up targeted the 2.618 Fibonacci extension before breaking below the 1H MA50 to start a lengthy consolidation. Based on that, we are targeting 23650 (Fib 2.618 ext) on the short-term.
-------------------------------------------------------------------------------
** Please LIKE 👍, FOLLOW ✅, SHARE 🙌 and COMMENT ✍ if you enjoy this idea! Also share your ideas and charts in the comments section below! This is best way to keep it relevant, support us, keep the content here free and allow the idea to reach as many people as possible. **
-------------------------------------------------------------------------------
Disclosure: I am part of Trade Nation's Influencer program and receive a monthly fee for using their TradingView charts in my analysis.
💸💸💸💸💸💸
👇 👇 👇 👇 👇 👇

USNAS100 Eyes 23350 Ahead of Powell & Earnings StormUSNAS100
The price maintains bullish momentum, as outlined in the previous idea, with a clean rejection from the 23280 zone. Today, volatility is expected to increase ahead of Jerome Powell’s speech and a wave of key earnings reports.
As long as price holds above 23140, the outlook remains bullish toward 23230 and 23350.
A short-term correction toward 23045 is possible if we get a 1H close below 23140.
Resistance: 23230 · 23350 · 23510
Support: 23045 · 22920

Nasdaq Index (US100 / NASDAQ):The Nasdaq index continues to move in a medium- to long-term uptrend, recently testing the 23,000 support zone and bouncing upward.
🔹 Bearish Scenario:
If the price breaks and closes below 23,000, it may lead to a decline toward 22,920, followed by a deeper move toward 22,650.
🔹 Bullish Scenario:
If the price holds above 23,200, further upside toward a new high around 23,400 is likely.
⚠️ Disclaimer:
This analysis is for educational purposes only and does not constitute financial advice. Always monitor the markets and perform your own due diligence before making any investment decisions.

Powell speech inspired SHORT for NAS100If the price reaches my set zone, i believe it will dump to collect liquidity before making new ATHs.
Tiny SL, huge TP.
good luck
NasdaqCOT data shows large speculators increasing net long positions on the Nasdaq-100, reflecting rising institutional confidence in tech and growth sectors. This positioning supports a bullish bias, especially as price holds above key moving averages and market breadth improves.

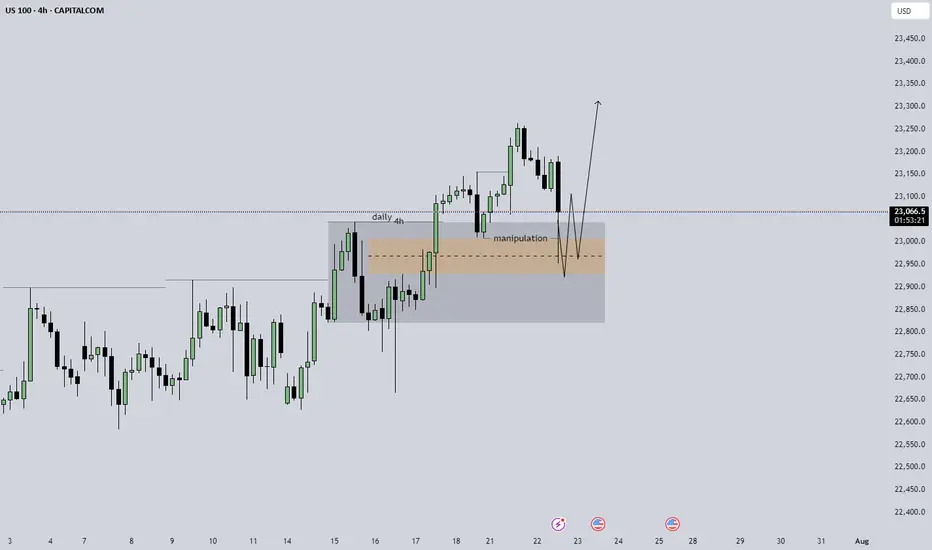
US100 expecting smth like this daily is strongly bullish, 4h is showing some sort of manipulation in the short, i am expecting something like the arrow that i pointed to happen on the m5 structure to try and take an entry, without that kind of circumstance stay out of the trade.
NAS100 Bullish Setup: Clean Structure & Entry Zone Pending📊 NASDAQ 100 (NAS100) remains bullish, showing a clean, well-structured uptrend—higher highs and higher lows 🔼📈.
Price has now pulled back into my optimal entry zone 🎯. At this stage, I’m waiting for a bullish break in market structure before considering an entry 🟢🔓.
Patience is key—let the structure confirm first.
Not financial advice ❌💼

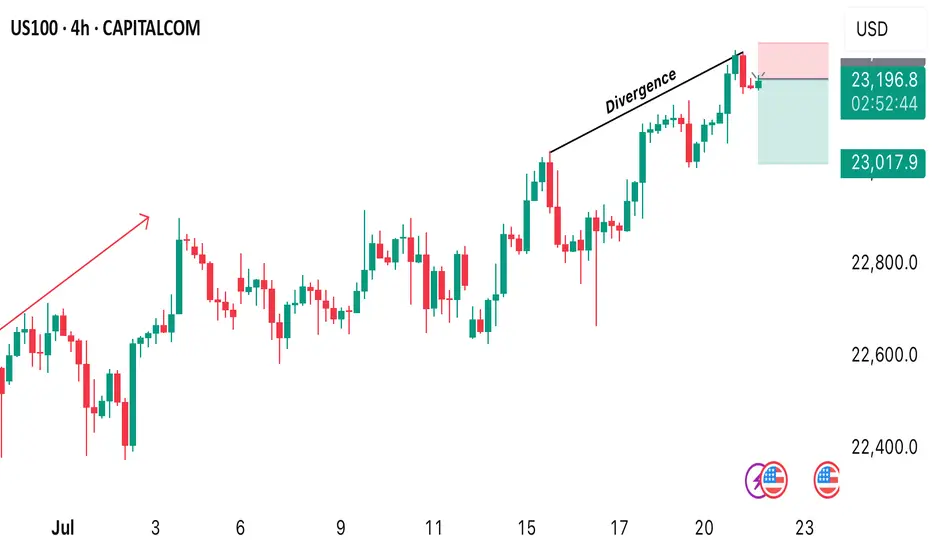
US100 SELL OPPORTUNITY Price is trading at 22204 and it provides us with a sell opportunity after market formed a divergence. A sell opportunity is envisaged from the current market price.
Properly navigating this ATH run in NASDAQ - No supply yetEverything is explained quickly in the video.
Main points:
1) Lows and bullish imbalances respected
2) It's very difficult to short without supply
3) May get cyclical take profit like previous years
Be sure to let me know what you think!

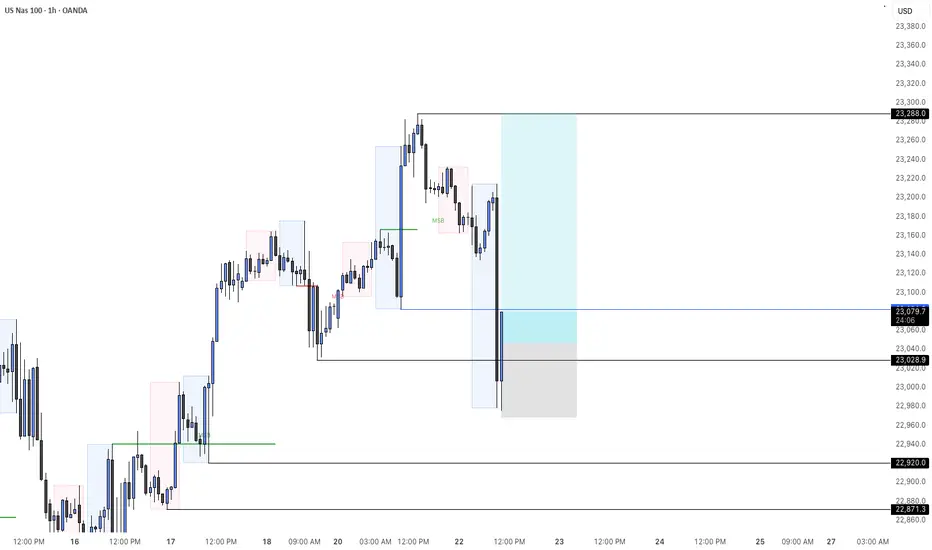
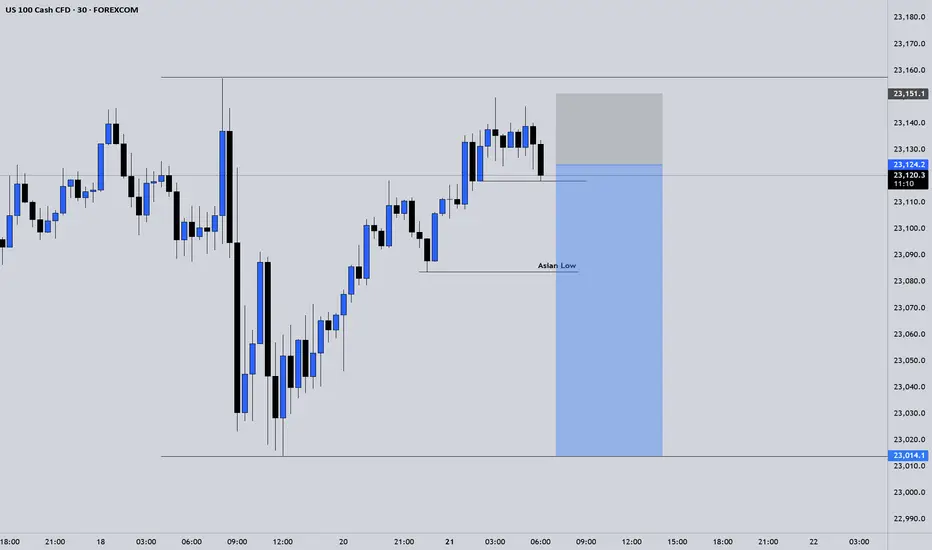
Short NAS100Elite Discretionary Analysis
Executed trade on 30m
Price is rejecting the previous liquidity pool zone.
Targeting New York Low and CIC LP.
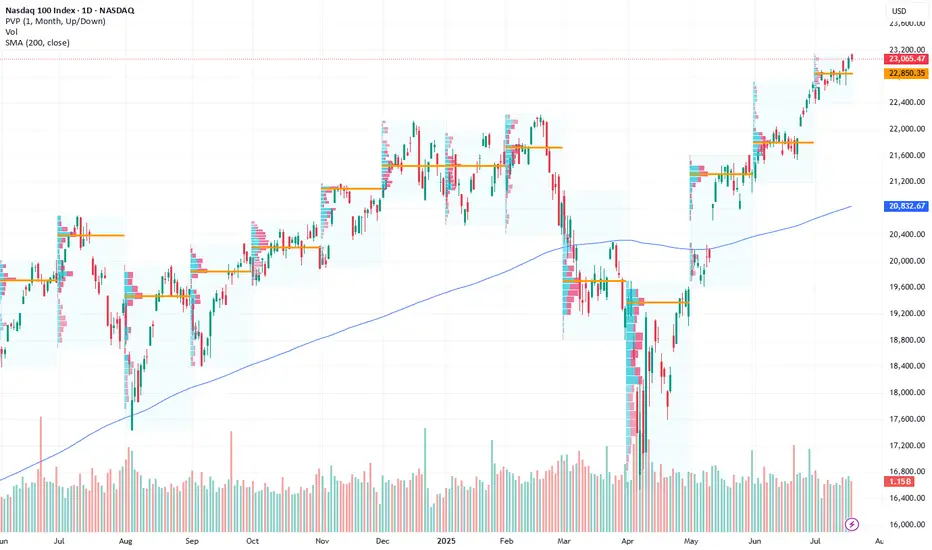
Go Long – Bullish Targets for Next Week- Current Price: $23065.47
- Key Insights: NASDAQ has exhibited resilience despite recent sentiment shifts,
showing signs of potential upside driven by a solid rebound in major tech
stocks. With earnings season approaching, improved performance in underlying
components reinforces long-term confidence in the index.
- Price Targets:
- T1: $23427.43
- T2: $23696.12
- S1: $22834.82
- S2: $22604.17
- Recent Performance: Over the past week, NASDAQ has consolidated near its
current levels, with intraday volatility driven by sector rotations and
macro concerns. While sentiment has weakened, the index remains supported by
key levels near the $23,000 mark.
- Expert Analysis: Analysts express optimism around key components such as
Apple, Microsoft, and Nvidia, which have recently seen improved outlooks.
Broader tech sector strength may drive NASDAQ higher. Caution is advised
given geopolitical uncertainties but upside opportunities dominate momentum.
- Sentiment Analysis:
- Current sentiment: 0
- Last week: 62.5
- Change: -62.5
- Total mentions: 386
- News Impact: Positive developments in semiconductor growth forecasts and
easing fears over rate hikes have supported bullish sentiment. However, last
week’s lower-than-expected inflation data and Federal Reserve signals for
"higher rates for longer" dampened sentiment overall.
NASDAQ INDEX (US100): Bullish Continuation Confirmed
NASDAQ Index broke and closed above a resistance of a horizontal
parallel channel on a daily.
It confirms a bullish trend continuation and a highly probable growth
to the next strong resistance.
Goal - 23300
❤️Please, support my work with like, thank you!❤️

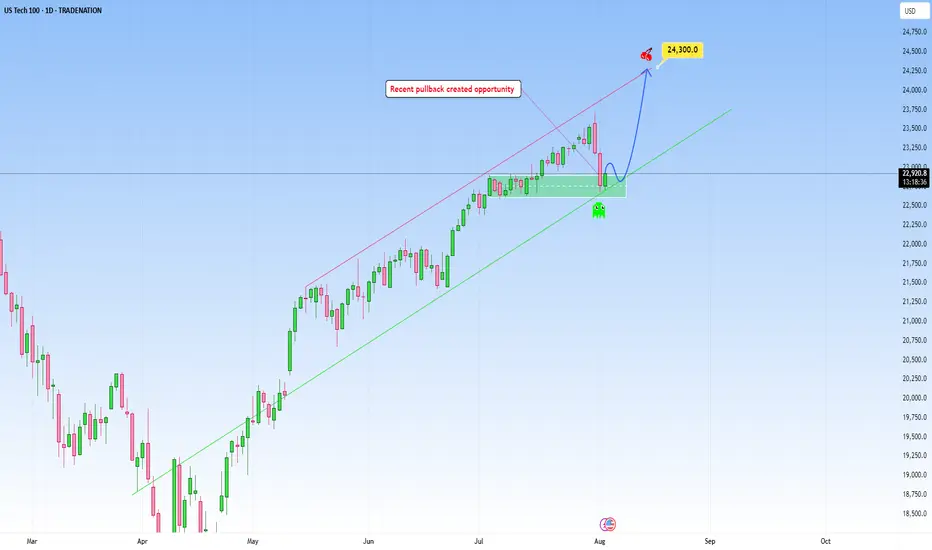
USTEC: Likely continuation following pullbackNAS100 climbed a steep uptrend and my expectation is for a continuation as marked on my chart, with an upside target at around 24,300.
This area here is where it can become a decision point, either price finds support and bounces, or it breaks below, and that’s when we might see the move start to extend lower.
If I were to take a side here, I would definitely choose more upside, but again only price action should determine next move.
But if price breaks below the trendline with conviction, it would invalidate the bullish scenario, suggesting that the uptrend may pause or could even reverse short-term.
Just sharing my thoughts for the charts, this isn’t financial advice. Always confirm your setups and manage your risk properly.
Disclosure: I am part of Trade Nation's Influencer program and receive a monthly fee for using their TradingView charts in my analysis.
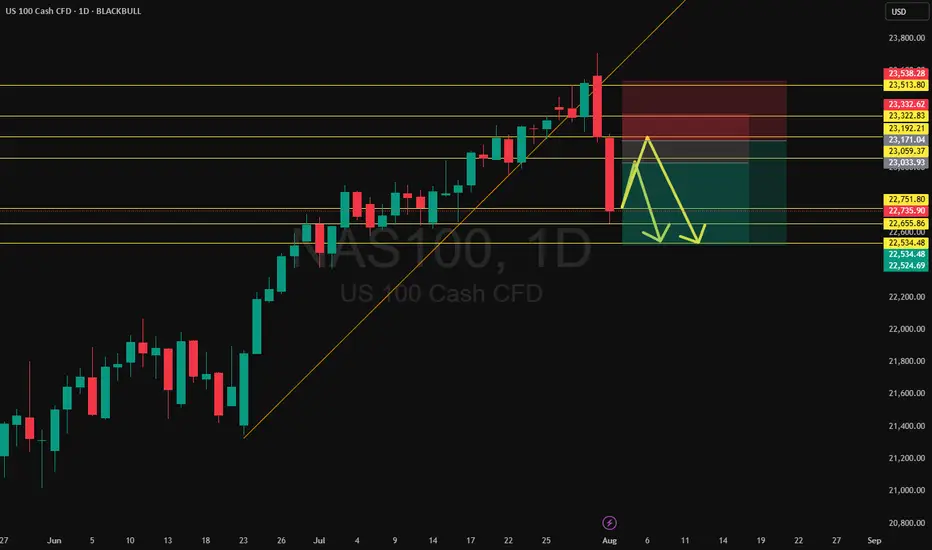
NAS100 Hits Monthly Level - Retrace or Reload?After a sharp leg down, NAS100 remains in a broader uptrend but is now reacting off a key monthly level. Expect a short-term retracement with the potential for a second leg lower. If bullish momentum returns, watch for an attempt to reclaim the level. Momentum is strong enough to challenge it again—traders should be ready for either a deep retrace or continuation move.