Big GAP Down to buyBuy oportunity I think. MA 100 and 200 almost flat on W timeframe, BIG GAP down to be close.
NNDM trade ideas

NNDM -3D -Printing for Electronics Company- New Hyping Industry?Nano Dimension Ltd is a provider of intelligent machines for the fabrication of Additively Manufactured Electronics (AME). High-fidelity active electronic and electromechanical subassemblies are integral enablers of autonomous intelligent drones, cars, satellites, smartphones, and in medical devices. The portfolio of the company includes Mechanical, Chemical, Applications, Industrial Design, and Artificial Learning areas. Nano Dimension machines serve cross-industry needs by depositing proprietary consumable conductive and dielectric materials simultaneously, while concurrently integrating in-situ capacitors, antennas, coils, transformers, and electromechanical components, to function at an unprecedented performance.
3D - Printing Industry Reversal?
The 3D printing industry has experienced a period of quiet evolution, but its integration with AI is poised to drive a transformative resurgence. AI's ability to enhance design optimization, automate workflows, and enable predictive maintenance will significantly amplify the potential of 3D printing. Together, these technologies are set to redefine manufacturing, allowing for smarter, faster, and more cost-effective production processes. This synergy will likely unlock new applications across industries such as healthcare, aerospace, and construction, heralding a powerful and innovative era for both fields.
Float: 213.771M
Short % of Float: 7.05%
Recent News:
Dec 05, 2024
Nano Dimension (NNDM) announced that it debuted its new breakthrough resin, Ataru, at the Formnext 2024 industry trade show in Germany last week. The Ataru resin is a new proprietary material developed by Nano Dimension for use in digital light processing 3D printers. It differs from other resin products on the market due to its ability to endure high temperatures while offering exceptional durability and resilience. Additionally, Ataru(TM) distinguishes itself with its low-loss dielectric properties to ensure outstanding performance in various radiofrequency applications.
Dec 6, 2024
Markforged MKFG said Friday its shareholders approved the pending acquisition by Nano Dimension NNDM.
In September, Nano Dimension agreed to acquire Markforged for $5 per share in an all-cash deal.
Shares of Markforged and Nano Dimension were up 1% and 11% in recent trading, respectively.
Overall Market Sentiment:
It’s always crucial to consider overall market sentiment when making trading decisions.
Trading Strategy:
Entry:
At recent price around $2.40
Waiting for a pullback into $2.20 - 2.30 zone
Breakout Zone:
$2.60
Resistance Zones:
$2.85 -3.00
$3.30
Surpassing these levels could signal a positive trend. Consider taking profits at these levels to realize gains.
Risk/Money Management
Take Profit (TP): Set a target at $3.60 - (The long-term potential could be significantly higher if they perform well.)
Stop Loss (SL): Set at under $2.00 to mitigate potential losses.
Chart Analysis:
Please refer to the attached chart for detailed analysis of price trends and movements.
Trading Advisory:
Exercise caution and consider market conditions and your own risk tolerance when trading. It's advisable to conduct comprehensive research or consult with a financial advisor before engaging in trading activities.
Disclaimer: This content is for informational purposes only and should not be considered financial advice.

Is NNDM Consolidation Finally Over?Weekly chart is being shown but I will summarize key bullish points on the daily as well.
General Note:
Found support at the 236 retracement($2.19) of the last low to high. This means alot of paper hands have exited.
If this did not hold it would be bearish.
Price is above a downward Trend line. We need to see this trendline broken on the daily chart and established as support.
Even better if we can weekly candles to do this in the next few weeks.
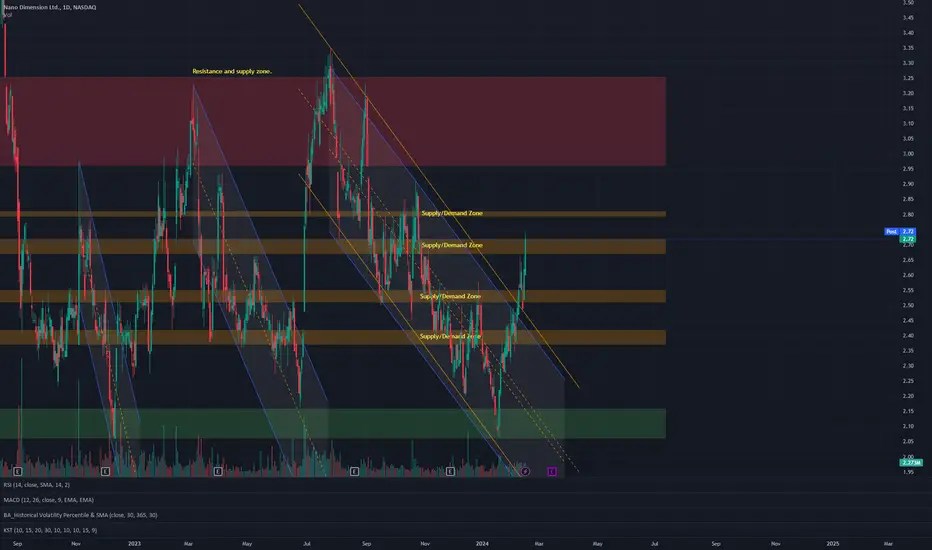
The orange areas are supply/demand zones at time frames lower than the daily but greater than and equal to an hour.
The red and green areas are supply/demand zones at the daily or higher. You need to see the orange zones
broken on the daily and established as support. The first red zone is the first boss. We need to get
through that and make it support to ensure this trend is changing.
It probably needs to happen soon because I expect to encounter resistance at the 200SMA on the weekly time frame
and I would like that resistance to be above that supply zone.
Weekly Notes:
The 8EMA crossed the 21 EMA on the weekly. It came down and touched the 21 and bounced.
This has not happened in the last four years I have been following this stock.
The 13 weekly EMA is equal to the 48 and if price stays above 2.40, it will cross it on the weekly.
The 30 Weekly SMA has leveled and is starting to point up. See Weinstein method.
Next thing I am looking for is the 30Weekly to cross the 50 Weekly and for the weekly 50 to level out and point up
Daily Notes:
13EMA has crossed the 48 EMA. This is generally bullish when both are not pointing down.
50SMA has crossed the 200 SMA
Broke above 200SMA Daily. Need to see a pull back and prove it's support.

My Last NNDM ChartDisclaimer: The fox is in the hen house. Murch has taken over and my investment strategy has now changed. I am no longer an investor and will be selling my position as the price skyrockets. Murch has done this before with Dryship. NNDM will be parceled out and sold off for cash.
Having said that, my final chart. These supply/demand zones have not changed in years. Orange is daily and below. Red is Daily and above. You need to break these zones and establish them as support before moving to the next. Look for volume to increase as this happens.
Butterfly just completed at an coincidental spot. Look for retracements to 236, 382, 500 or 618 of the CD leg.


Bearish BAT on NNDMScoped this Bearish Bat forming a while ago and wouldn't youknow it. NNDM makes another aquisition to push the stock up. Let's see if it completes.

8/19/24 - $nndm - Long into print @2.158/19/24 :: VROCKSTAR :: NASDAQ:NNDM
Long into print @2.15
- net cash valuation of 270 mm or so (so yea, the company's valuation is basically negative)
- the burn between 50 and 100 mm a year in cash. let's say that's 100 mm
- among the 3D print companies, it's really the only one i've found that's even remotely ownable bc it's a. revenues aren't tiny b. in theory it's growing a bit and c. doesn't have god awful margins.
- fact that it's based in Israel i think has hurt its valuation because of the conflict
- but they report tmr.
- valuation negative and at lows, seems washed out
- look at oil, look at stonks today... conflict ending?
- even my other NASDAQ:NICE (israel stonk) is ripping today
like the setup. i'm long 50 bps into the print.
lmk if u see it differently, always.
V

NNDM spiked out of its low but still has room to the upsideNNDM spiked out of its low but still has room to the upside…
Basic supply demand move

Days NNDM issued share offerings in 2020 and 2021The blue lines are all the days NNDM issues share offerings in 2020 and 2021

NNDM Nano Dimension Options Ahead of EarningsAnalyzing the options chain and the chart patterns of NNDM Nano Dimension prior to the earnings report this week,
I would consider purchasing the 3usd strike price Calls with
an expiration date of 2024-5-17,
for a premium of approximately $0.15.
If these options prove to be profitable prior to the earnings release, I would sell at least half of them.

NNDM UP UP UP!NNDM Adam and Eve pattern. HODL!
slowly moving but the trend is UP! first target is 12-13 and once we are above the neck line we are going to have an awesome rally up to $70.

Updated NNDM Chart 02/15/2024Update on the chart.
Had a scare since the last chart when the stock hit the zone at $2.50 and fell sharply but it did not exit the channel.
Price bounced off the bottom of the channel and headed back up. I noticed possibly another/different channel possibility(charted with orange lines and no fill color) that could indicate a reversal. It was weak with only two touches prior to this last bounce. Price did breakout the new channel as well and then back tested that channel and bounced up so it was fairly legit.
Notice price ran through the 2.50 zone. My Theory is the last drop to 2.07 shook out all the paper hands so hopefully it is now a strong level of support going forward.
$NNDM will Rally in 20242024 will be the year of NASDAQ:NNDM Big run. Short Term Target is $16, Mid Term Target is $46-48. Long Term is $100+

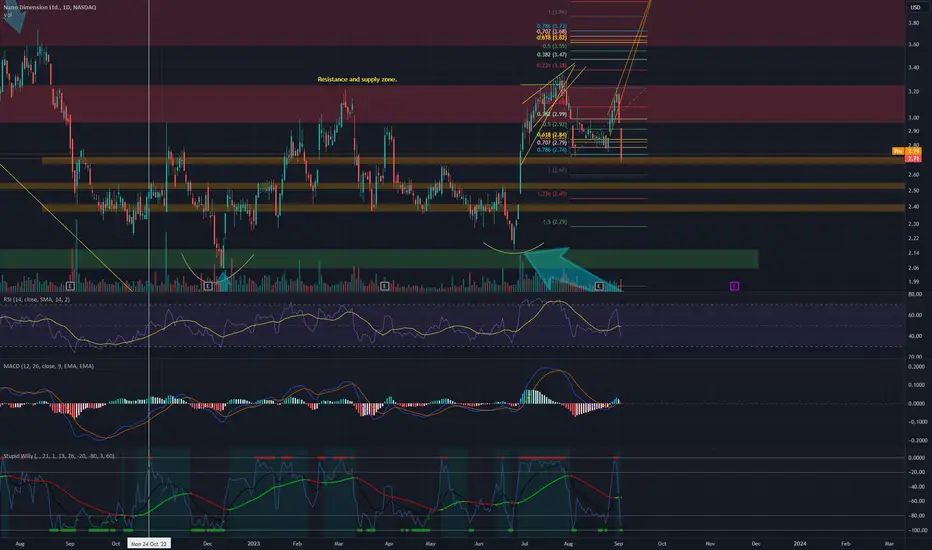
My thesis for NNDM running to 3.50 by May**THIS IS NOT FINANCIAL ADVICE**
This to track how well my technical analysis is for securities I may or may not be invested in.
There is a lot going on this chart but I cleaned it up as best I could so that what I see is a bit clearer.
On this chart you see:
1) A fib channel from the december low/march high/june low.
I have removed a lot of the other levels to clean up chart and focus on the most relevant levels that have acted as strong support/resistance.
I have also made the lines dashes and thicker to distinguish it from the fib retracements.
You will thick dashed diagonal lines in orange, yellow red and grey on the top and bottom of channels
2) Two downward channels that NNDM has traded in after a low to high run.
3)Two fib retracements of the last two runs*. I only have the .114/1.114 and the high low points for a reason. They are all that matters for this thesis.
Take note of the 1.114 of the first runup and look at the 1.114 of the last runup
4) Three date/price ranges. The orange horizontal and vertical arrows with white labels showing the percentage of the move, length and volume in white text.
Two of them are based on the last two runs* and the third is a run from the bottomm to anticipated top based on the fib channel (log mode)
5) My customary Supply/Demand zones.
6) A vertical blue line of the range for the latest we hit 3.50.
Based on the current trend I think NNDM is headed to 3.50 and probably at least a weak test of the supply zone that starts at 3.59 by May. June at the latest.
If the test of the supply zone fails, which I think is highly likely, then we are most likely headed back down to test the 2.38-2.47 demand zone.
This will possibly coincide with the bottom of the fib channel depending on timing. We should at least see a sell test to that level and a wick down.
I am still bullish on the stock cause even if the bearish portion of my thesis plays out, it is still a higher low and higher high since the spring/sell test I called out in December 2022
*Runs: Last two runups were from:
December 12th 2022 to March 6th 2023
June 26 2023 to July 27th 2023


NNDM Long term trend about to recoverShowed a bullish star on the daily yesterday, and will probably return back to its long term (6 months) trend.
EOM around 13$


Plotting out NNDM Time Line With Abbot Cooper InvestigationI charted out the dates (vertical blue lines) with what was mentioned in the article announcing Abbot Cooper investigation. I have NNDM and SSYS stock price included in the chart with notes. Hope everyone can read.
NNDM price is the candles. SSYS price is the bars.
I want to point out, if you follow NNDM forum on reddit, Stern purchased a month before I called out a possible markup phase incoming. He sold right around the time I called for a pullback cause NNDM was in an ascending wedge and bulls looked to be getting exhausted.

Nano Dimension Ltd: Trading Idea for 20/10/20233D printer manufacturer Nano Dimension Ltd. has announced an additional $1 billion share repurchase. With these funds, the company attempted to acquire its rival Stratasys but failed. Instead, Nano Dimension management plans to pursue mergers with several other market participants, which will ensure potential income growth and expand its business.
Therefore, today, we focus on the Nano Dimension Ltd (NASDAQ: NNDM) stock chart.
On the D1 timeframe, support has formed at 2.46, with resistance at 2.81. A break in the downward trend is highly likely.
On the H1 timeframe, the short-term target for the price increase is around 4.63; while in the medium term, it could reach 7.25.
—
Ideas and other content presented on this page should not be considered as guidance for trading or an investment advice. RoboMarkets bears no responsibility for trading results based on trading opinions described in these analytical reviews.
The material presented and the information contained herein is for information purposes only and in no way should be considered as the provision of investment advice for the purposes of Investment Firms Law L. 87(I)/2017 of the Republic of Cyprus or any other form of personal advice or recommendation, which relates to certain types of transactions with certain types of financial instruments.
Risk Warning: CFDs are complex instruments and come with a high risk of losing money rapidly due to leverage. 67.85% of retail investor accounts lose money when trading CFDs with this provider. You should consider whether you understand how CFDs work and whether you can afford to take the high risk of losing your money.

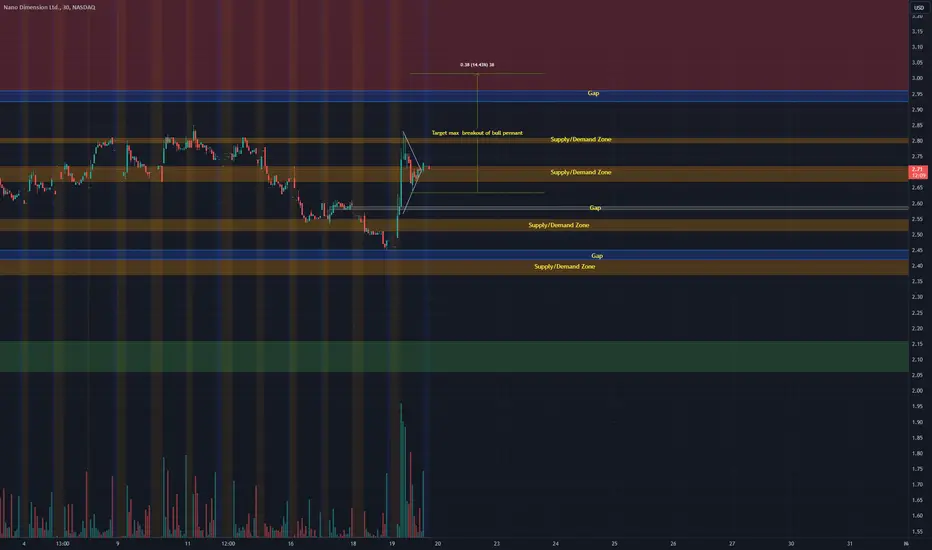
Updated NNDM AnalysisThey are playing with us. They didn't fully fill the gap from June and created a new gap.
If the pennant breaks out it will probably go to ~3.02 which is in that major Supply/Demand Zone and will fill one of the gaps.
This also means the price is going to come back down once it reaches that level at some point. Do not sell at those gaps cause someone wants those shares for cheap.
Updated NNDM Chart On Two Day Time FrameAdded some channels based on speed fans and fib channels.
Drawings are from multiple time frames but the higher time frame is a cleaner and easier to look at.
13/48EMA and 50/200MA are still bullish despite break below 2.63.

NNDM Possible Double Bottom Before Big Sell-OffLooking at something with small risk for a nice size reward. The WLB is a good place for support for a double bottom, but I think it will sell of one more time before it starts its uptrend.
Its possible that the $2.20 level will hold and uptrend could start, but this is a lower confidence scenario
