$NNDM Target PTs 11.50-16Nano Dimension Ltd., together with its subsidiaries, provides additive electronics in Israel and internationally. Its flagship product is the proprietary DragonFly lights-out digital manufacturing (LDM) system, a precision system that produces professional multilayer circuit-boards, radio frequency antennas, sensors, conductive geometries, and molded connected devices for prototyping through custom additive manufacturing. The company also provides nanotechnology based conductive and dielectric inks; and DragonFly and Switch software to manage the design file and printing process. It markets and sells products and services to companies that develop products with electronic components, including companies in the defense, automotive, consumer electronics, semiconductor, aerospace, and medical industries, as well as research institutes. The company was founded in 2012 and is headquartered in Ness Ziona, Israel.
NNDM trade ideas

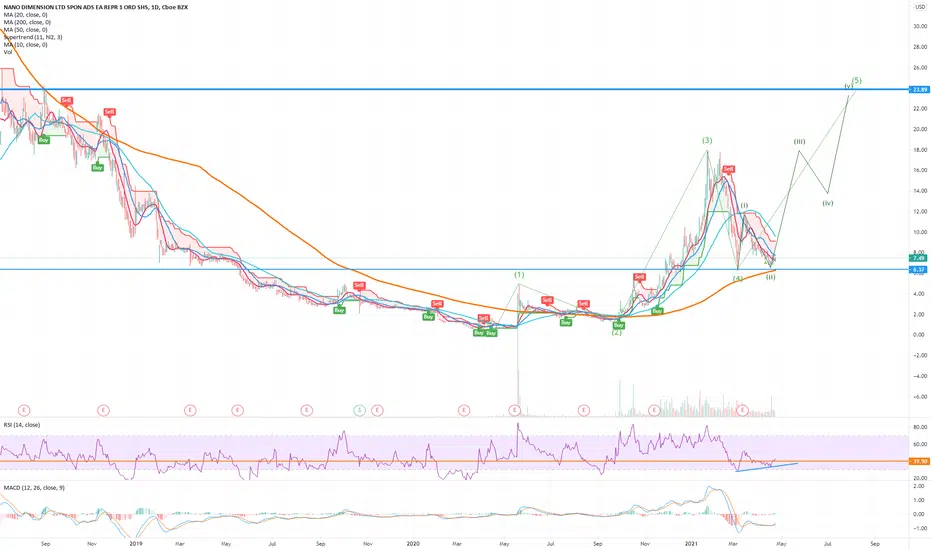
Is the worst time over?I see a double bottom with bullish divergence and a breakout in RSI. MACD Crossed up too.
It may be a runner in the coming week.
NNDM countNNDM has just been killing me lately. It has one last chance on this count. I would love to see it move out of this double bottom.


Long NNDM Bullish DragonLong here, bullish divergence at a critical iceline, potential bullish dragon breakout

NNdM I’m considering a long on NNDM here. I like it finally found support above 4hr 20 ema. Has struggled for months to get above. Could be a good bullish sign worth the trade. Main trade is confirmed support above 8:10

NndmLook for a breakout of 8.20$. And confirmed support hold. Looks like it s finnalt turing around but can’t trust until it starts holding above 8.20ish

NNDM bullish casePossible bottom if this uptrend holds and stock stays above $6.50. Daily bullish divergence so big move up could be coming

NNDM Back to $11NNDM spent pennies on the DeepCube acquisition but at least now investors can see they are serious about using the capital they raised over the last year for acquisitions and that they probably won't overpay for companies.
See chart for swing trade levels. I'm long the stock.


NNDM acquires Deep LearningNNDM an old stock I traded last year has acquired Deep Learning. This in return will help NNDM grow in the long the term by adding this AI too their machines for more precise pcb boards and other electronics. Competition with Deep Learning is none to my knowledge of in the 3D printing field. There are two other AI companies that could get acquired by another company that I know of which are Google's AlphaZero and DeepMind. Again in the 3D world there isn't much competition, which NNDM might rise to over $40 a share by eoy if the stock market picks up.
TA: in the short term
-RSI broke out which is bullish for a reversal/untrend
-MACD is bullish
-Downtrend as been broken, but now guessing there is a second. As an investor or speculator on the sidelines you may want to wait for a breakout above the resistance lines unless you feeling frisky.
-Resistance is at $7.58, $7.33, $7.79, and $8.16
-Support is at $7.14, $6.73, and $6.59
-We are close to the 50ema and hope for a breakout tomorrow. If not then NNDM will suffer on the fate of the whole market and not the news.
Final toughts
Seeing them get into AI they could have massive swings like VERI, which is another out AI stock that was a pennystock in price at the start of the pandemic. I will continue to watch this stock, but its risky jumping into an acquation trading with a bearish market. Most tech and growth stocks are down, so its very possible tomorrow this pump would be short lived. I give it a long, but I would remain neutral and could pickup a few shares. A guy on YT does the 33% trading style which is buy a $100 on day 1 wait buy another $100 on the dip and wait and spend your last $100.

How long do you think it is gonna last?NASDAQ:NNDM
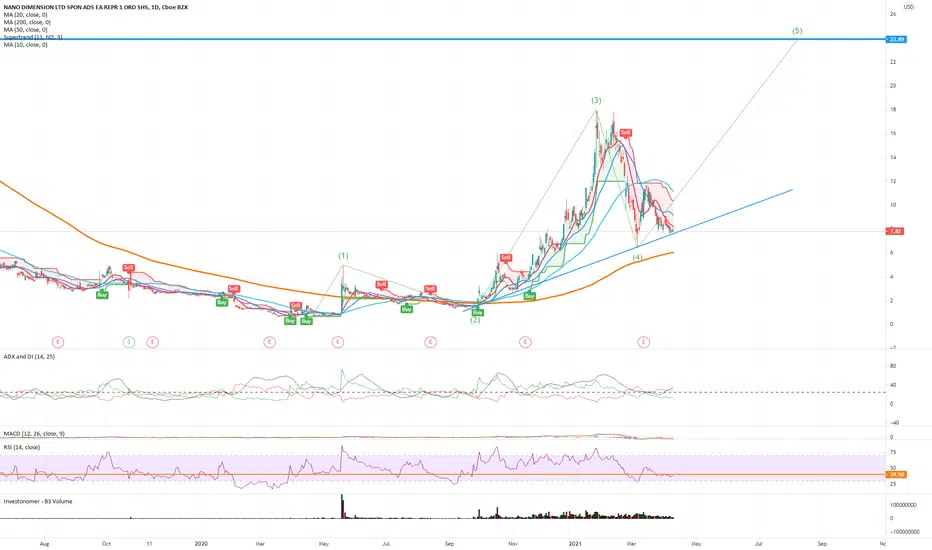
On 16th April, the price action was bullish with a spike in the traded volume. Now I can't say for sure, but if it breaks the resistance shown with the black line at points A or C, the bullish reversal may be on the way real soon. But if it breaks the support at $6.68 at point B and $6.27 (orange dashed line), the next support will be at $5.35. So I guess we just have to wait and see how it will all play out.
This is not in any way financial advice.
*The solid blue lines are Fib retracement lines
**The dashed orange lines are Volume profile

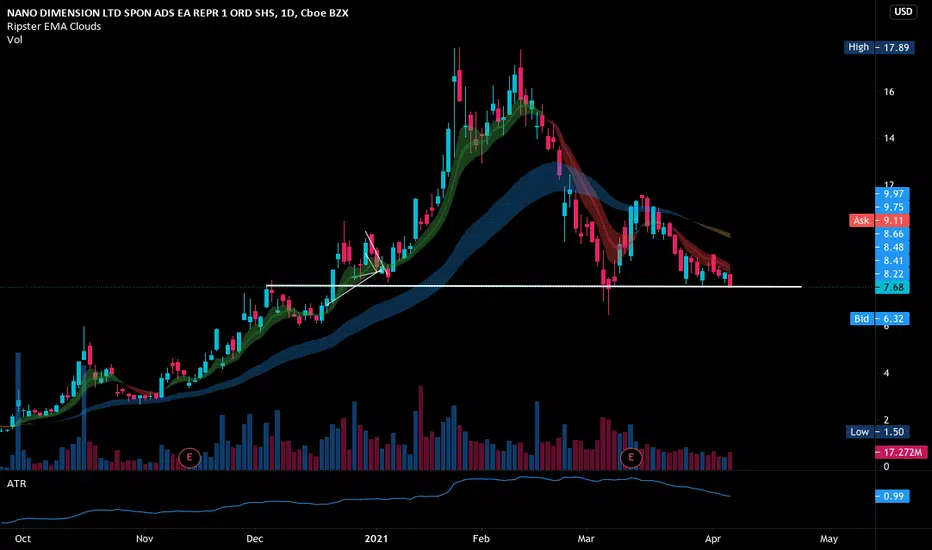
What's not bullish about this???Primed to run. A huge bounce of EMA 200 which currently is at $7.28 and should serve as big support. The chart speaks for itself.
I am no financial advisor and this is not financial advice.


Should see some slow and steady gains Corrections looks almost to be over and we should see some movement on upside.
NNDM LongNNDM an exciting 3-D printing company approaching an interesting technical inflection point. It is sitting on its long term support (previous resistance) and also appears to be near the bottom of a falling wedge pattern. With the tight coiled MACD begging to be bought, I am long and will sell if it violates the blue line of the "HODL area". Good luck at the Casino ;)


NNDM Solid BuyNNDM is trading off of old resistance and more recent support. I think this stock has huge potential and is looking to take a good bounce off this support line. Remember to watch the volume!! Happy trading!!
NNDM no news is bad newsStill long the stock but without some catalyst, NNDM will move flat to down for the foreseeable future.

NNDM looking for a bounceNNDM looking for a bounce.
Might already be bouncing from Friday's close. Definitely one to watch on Monday as it is very close to support at $8.00. Failing that we can see a drop to around $6.75.
If one of these confirms the bounce, it will create a double bottom and I believe it will go up to at least $10 and possible $13.
Where depending on velocity it could form a bull-flag with good chances for success.
If it rips past 10~13, it will most likely form a bull-flag that will probably fail.
The pivot points are extremely important and beware that this stock has a considerable short interest.


What do you think will happen!?NASDAQ:NNDM
I don't think there will be much change in the price till Thursday, and by that, I mean the price action is in range (Figure on the right).
But I wonder!? I have noticed many people show the descending triangle, saying there will be a bullish breakout, but from what I see, depending on the time frame as shown in the first and second figure from the left, it could be either a bullish or bearish breakout.
Now I know no one can tell for sure what is about to happen, but I want to see how many people think it will be bullish and how many think it will be bearish.
I would appreciate any constructive criticism regarding the chart analysis as well.
