NTCT: Island Gap PotentialThere is an interesting phenomenon that occurs often: when a gap down of this size occurs, followed by a bottoming action and a large white candle forms, this often becomes an island gap. HFTs that gapped the stock down gap it up again.
The fact that the gap down candle is a huge white candle for this chart indicates that the gap down is below fundamental values and Dark Pools were the buyers against the HFT selling. The drop in Accumulation/Distribution at that time was smaller funds dumping which often triggers Dark Pool TWAPs. NASDAQ:NTCT has a high Percentage of Institutional Holdings at this time and it's a lower-priced stock in a pricey market.
NTCT trade ideas

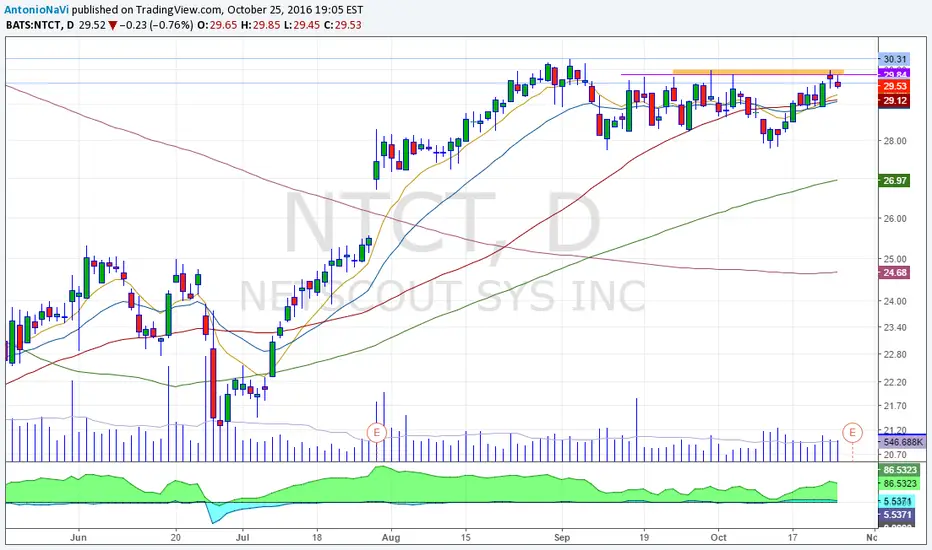
NTCT consolidating nicelyNTCT is consolidating nicely at the 61.8 fib; needs more volume for the next leg up but worth keeping on watch

NTCT: Sort opportunityAn intraday high potential, Back Tested Sort Analysis.
We ll try to enter into the correction of the uptrend movement.
DETAILS ON THE CHART
NOTE: Entry range area above the entry point, is calculated upon 80% of the recorded pullback back tested past performances
DISCLAIMER: This is a technical analysis study, not an advice or recommendation to invest money on.

Dow drops 1,175 points :( #18 NTCT)The last time I publish a short selling Idea was in February 9-2018
And now this kind of opportunities are scarce, because the whole market is bullish and you can not sell short stocks only because the Dow Jones had a bad week
But I like the process of search because I spend hours searching in my watch-list only to find a few ideas
Now go to the technical aspect here
Remember that I always say that resistance becomes support
here it happens backwards, support becomes resistance, and it press the price down.
the broke of that support was with a bearish overnight gap (Red circle) big red candlestick

Netscout is breaking all resistancesSignals:
1-bottoms
2-channel breakout
3-gap
4-potential pennant
Buy 28.00 (breakout of top pennant bar)
Stop loss 26.72 (-1 tic of pennant low)
Target 34.00 (Sizing+resistance level)

NTCT ProjectionsFirst target is for 29.20. if it goes till 31.1, then there is a chance to go to 35 with gap up. (that still need some confirmation which i projected in yellow).
