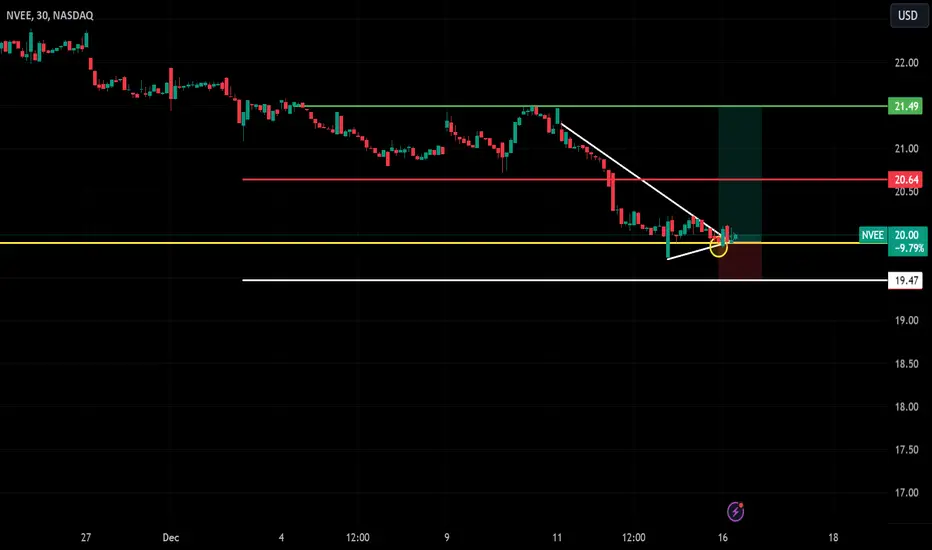
NVEE Trendline Breakout with Upside Potential !NVEE on the 30-minute chart shows a breakout above the descending trendline, signaling a potential reversal and bullish momentum.
Entry: $19.99
Stop-Loss: $19.47
Target 1 (T1): $20.64
Target 2 (T2): $21.49
The price action is supported by a trendline break and consolidation near the support zone. A
Next report date
—
Report period
—
EPS estimate
—
Revenue estimate
—
0.50 USD
27.98 M USD
941.26 M USD
58.53 M
About NV5 Global, Inc.
Sector
Industry
CEO
Benjamin R. Heraud
Website
Headquarters
Hollywood
Founded
2011
FIGI
BBG005BT60Y8
NV5 Global, Inc. engages in the provision of professional and technical consulting and certification solutions for the public and private sector. It operates through the following segments: Infrastructure (INF), Building, Technology, and Sciences (BTS), and Geospatial Solutions (GEO). The Infrastructure segment covers engineering, civil program management, and construction quality assurance practices. The Building, Technology, and Sciences segment includes energy, environmental and building program management practices. The Geospatial Solutions segment includes geospatial solution practices. The company was founded on September 12, 2011 and is headquartered in Hollywood, FL.
Related stocks
NVEE - 17 months DESCENDING TRIANGLE══════════════════════════════
Since 2014, my markets approach is to spot
trading opportunities based solely on the
development of
CLASSICAL CHART PATTERNS
🤝Let’s learn and grow together 🤝
══════════════════════════════
Hello Traders ✌
After a careful consideration I came to the conclusion that:
-

TOP US-Stocks: Buy-Signal NVEEThe stock just broke through a perfect buy point and triggered a buy-signal. The stop loss level and profit target are shown in the graphic.
All stocks on our watchlists meet the hard selection criteria according to Mark Minervini's Trend-Template and William o' Neil's CAN SLIM methodology AND
are

NV5 Announces $100 Million Share Repurchase ProgramNVEE: NV5 Global, Inc.
2022-08-29 08:00:37 NV5 Announces $100 Million Share Repurchase Program

NV5 Awarded $8 Million Contract Expansion by Southwest UtilityNVEE: NV5 Global, Inc.
2022-08-09 08:00:00 NV5 Awarded $8 Million Contract Expansion by Southwest Utility

$NVEE Bullish candle with high volume targeting 138-140Best entry if its falls to 116 -115 to close previous gap then targeting 138-140 or higher

NVEE: CUP AND HANDLE BREAKOUT WATCHNvee :
Cup and handle.
Long above 108.5.
Stop below breakou t candle.
Target on the chart.
Trade safe!

CONNCONN: Conn's, Inc.
2021-12-15 06:00:00
Conn’s Announces Authorization of $150 Million Share Repurchase Program

NV5 Awarded $15 Million Infrastructure Engineering Design ContraNVEE: NV5 Global, Inc.
2021-12-15 08:00:00
NV5 Awarded $15 Million Infrastructure Engineering Design Contract by New York City Department of Design and Construction

NV5 Awarded $6 Million Transportation Infrastructure Contract byNVEE: NV5 Global, Inc.
2021-06-21 08:00:00
NV5 Awarded $6 Million Transportation Infrastructure Contract by City of Fresno

See all ideas
Summarizing what the indicators are suggesting.
Neutral
SellBuy
Strong sellStrong buy
Strong sellSellNeutralBuyStrong buy
Neutral
SellBuy
Strong sellStrong buy
Strong sellSellNeutralBuyStrong buy
Neutral
SellBuy
Strong sellStrong buy
Strong sellSellNeutralBuyStrong buy
An aggregate view of professional's ratings.
Neutral
SellBuy
Strong sellStrong buy
Strong sellSellNeutralBuyStrong buy
Neutral
SellBuy
Strong sellStrong buy
Strong sellSellNeutralBuyStrong buy
Neutral
SellBuy
Strong sellStrong buy
Strong sellSellNeutralBuyStrong buy
Displays a symbol's price movements over previous years to identify recurring trends.
Curated watchlists where NVEE is featured.

Frequently Asked Questions
The current price of NVEE is 22.91 USD — it has decreased by −0.65% in the past 24 hours. Watch NV5 Global, Inc. stock price performance more closely on the chart.
Depending on the exchange, the stock ticker may vary. For instance, on NASDAQ exchange NV5 Global, Inc. stocks are traded under the ticker NVEE.
NVEE stock has fallen by −1.25% compared to the previous week, the month change is a −0.26% fall, over the last year NV5 Global, Inc. has showed a −7.87% decrease.
We've gathered analysts' opinions on NV5 Global, Inc. future price: according to them, NVEE price has a max estimate of 24.00 USD and a min estimate of 23.00 USD. Watch NVEE chart and read a more detailed NV5 Global, Inc. stock forecast: see what analysts think of NV5 Global, Inc. and suggest that you do with its stocks.
NVEE reached its all-time high on Nov 15, 2022 with the price of 38.74 USD, and its all-time low was 1.75 USD and was reached on Oct 9, 2013. View more price dynamics on NVEE chart.
See other stocks reaching their highest and lowest prices.
See other stocks reaching their highest and lowest prices.
NVEE stock is 1.40% volatile and has beta coefficient of 0.57. Track NV5 Global, Inc. stock price on the chart and check out the list of the most volatile stocks — is NV5 Global, Inc. there?
Today NV5 Global, Inc. has the market capitalization of 1.54 B, it has decreased by −0.52% over the last week.
Yes, you can track NV5 Global, Inc. financials in yearly and quarterly reports right on TradingView.
NV5 Global, Inc. is going to release the next earnings report on Aug 6, 2025. Keep track of upcoming events with our Earnings Calendar.
NVEE earnings for the last quarter are 0.17 USD per share, whereas the estimation was 0.17 USD resulting in a −0.23% surprise. The estimated earnings for the next quarter are 0.30 USD per share. See more details about NV5 Global, Inc. earnings.
NV5 Global, Inc. revenue for the last quarter amounts to 234.04 M USD, despite the estimated figure of 228.80 M USD. In the next quarter, revenue is expected to reach 252.80 M USD.
NVEE net income for the last quarter is 428.00 K USD, while the quarter before that showed 5.43 M USD of net income which accounts for −92.12% change. Track more NV5 Global, Inc. financial stats to get the full picture.
No, NVEE doesn't pay any dividends to its shareholders. But don't worry, we've prepared a list of high-dividend stocks for you.
As of Jul 19, 2025, the company has 5.02 K employees. See our rating of the largest employees — is NV5 Global, Inc. on this list?
EBITDA measures a company's operating performance, its growth signifies an improvement in the efficiency of a company. NV5 Global, Inc. EBITDA is 115.79 M USD, and current EBITDA margin is 12.48%. See more stats in NV5 Global, Inc. financial statements.
Like other stocks, NVEE shares are traded on stock exchanges, e.g. Nasdaq, Nyse, Euronext, and the easiest way to buy them is through an online stock broker. To do this, you need to open an account and follow a broker's procedures, then start trading. You can trade NV5 Global, Inc. stock right from TradingView charts — choose your broker and connect to your account.
Investing in stocks requires a comprehensive research: you should carefully study all the available data, e.g. company's financials, related news, and its technical analysis. So NV5 Global, Inc. technincal analysis shows the neutral today, and its 1 week rating is buy. Since market conditions are prone to changes, it's worth looking a bit further into the future — according to the 1 month rating NV5 Global, Inc. stock shows the buy signal. See more of NV5 Global, Inc. technicals for a more comprehensive analysis.
If you're still not sure, try looking for inspiration in our curated watchlists.
If you're still not sure, try looking for inspiration in our curated watchlists.