NVTS could double from here by earings callNavitas Semiconductor (NVTS) is poised for a strong rally soon, driven by several compelling factors. Most notably, the stock surged over 24% on July 22, 2025, breaking out to new 52-week highs around $8.47, reflecting renewed investor enthusiasm.
Adding to the bullish sentiment, members of the U.S. Congress have been buyers of NVTS stock recently, highlighting insider confidence and drawing retail investor attention to the ticker. Congressional purchases often signal perceived long-term value in a stock, especially in cutting-edge tech companies aligned with national innovation priorities.
NVTS trade ideas
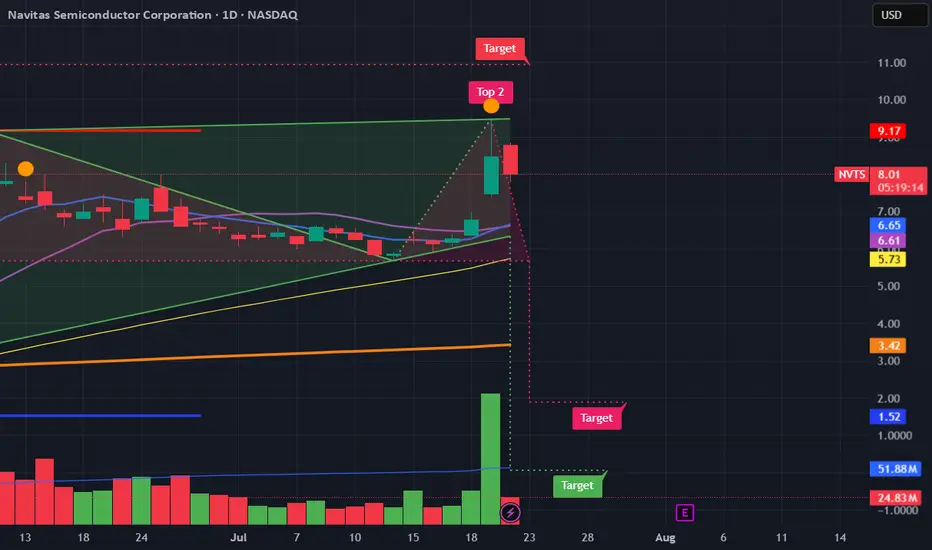
NVTS Analysis Are we Heading to $9+ Good afternoon Trading Family
Based on what we currently see with NVTS are two scenarios happening:
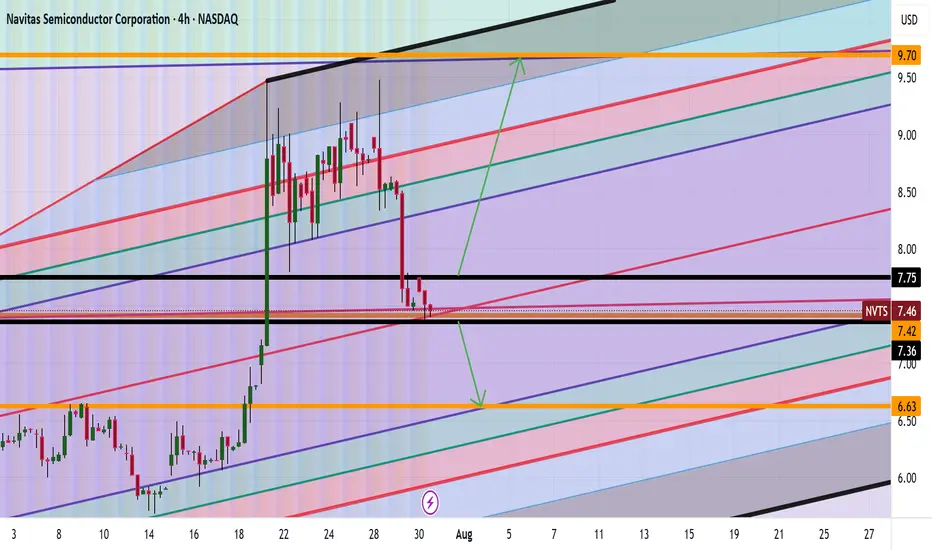
1) Above 7.80 highs we will thus be heading to the 9-9.7 range
2) Below 7.30 lows then we will be heading to the 6 dollar range
Happy Trading
Trade Smarter/ Live Better
Kris
07-24-2025 BUY NVTS Navitas Semiconductor (NVTS) Surges 24.7%: Is This an Indication of Further Gains?
BUY $8.62
SELL$9.45
ASK $0.83
9%

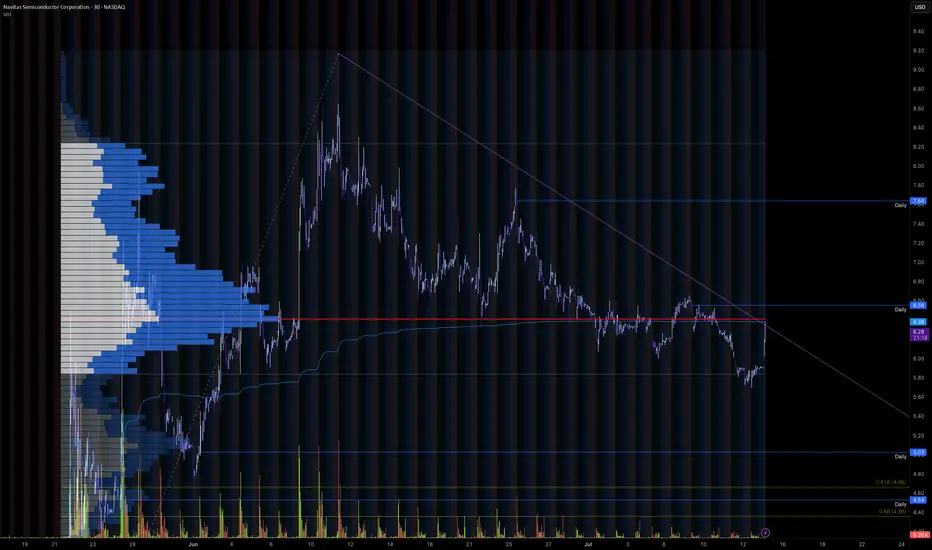
Trendline Breakout for Wave 3Navitas is currently looking at breaking out of its recent downtrend to potentially begin wave 3 of its move up, which, as we all know, is the most impulsive move.
Could be very tasty after a 350% pump already
Need to get above the range POC and breakout of the trend line, would be looking to get in on the retest of the downtrend line.
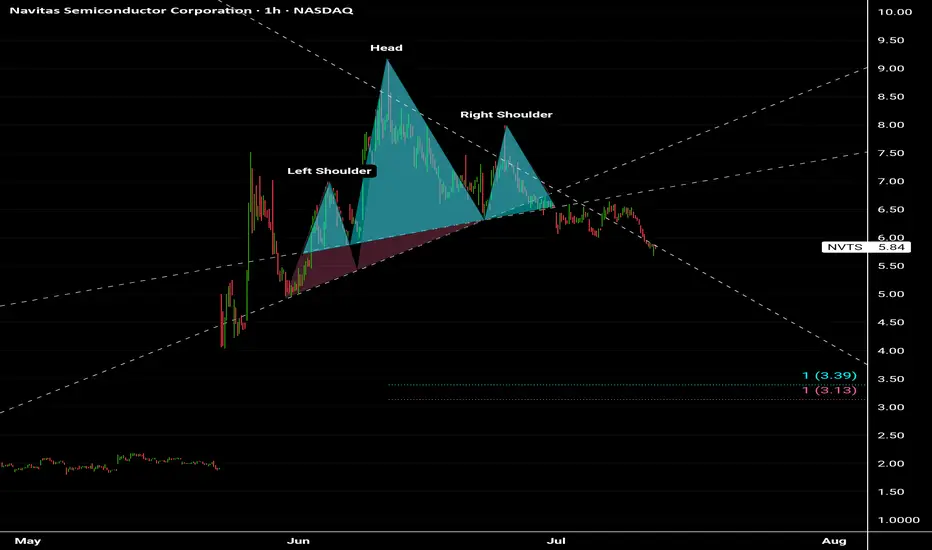
Navitas Semiconductor Corporation NVTS Another Negative Senario in Navitas Semiconductor Stock ...
Head and Shoulders patterns
Target prices between 3.00$ - 3.50$
🤕🤕🤕🤕
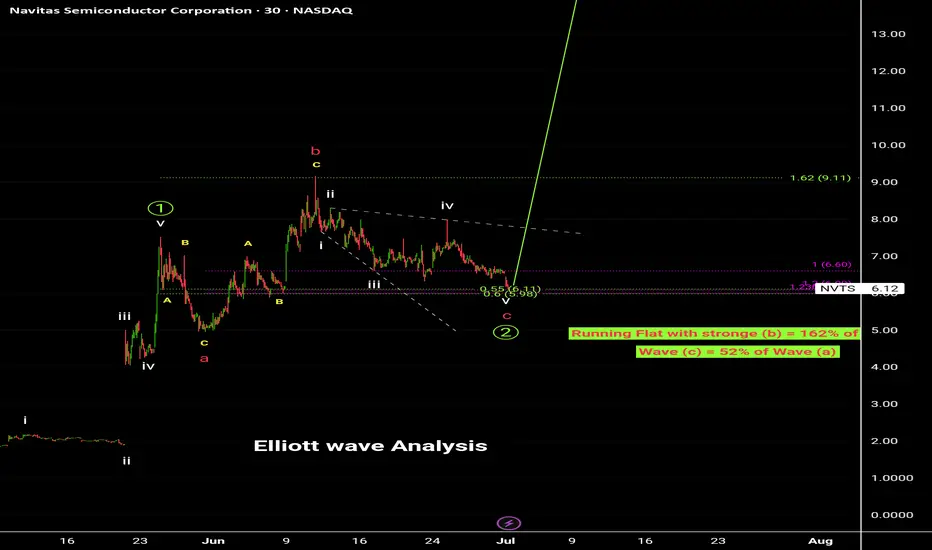
Navitas Semiconductor Corporation ( NVTS )Unfortunately, W1 completed at 7.52$, then we started W2 formed as a Running Flat correction with strong (b)= 162% of starting wave (a) and it come as zigzag correction, we are Today at the End of wave (c) that comes as an contracting ending diagonal which is supposed to end at 60%(5.98$ - 6.00$) of wave (a), / or wave (c) = 100% (6.60$) - 123.6% (5.98$) length (a).
### There were cases wave (c) Ended at least 60%(5.89$) of wave (a).
Running Flat correction is the ending of W2, after that, we going to start W3 the Motive Powerful Expending Wave ever that its Target price = 26.40$ - 27.30$ at that level we also end Nen-Star Harmonic pattern to start correction of W4 to about 16$-20$ depending on How aggressive Sellers will deal with W4, at the End we will Expect to End W5 between 37$ - open Zone to 40$.
# Explosive 💣 level to make sure we completed W2 and starting W3 to Pass level 6.70$.
# Highly recommended for starting Buying Now.

Navitas Semiconductor Corporation (NVTS).Unfortunately, we completed W1 at 7.52$, then we started W2 formed as a Running Flat correction with strong (b)= 162% of starting wave (a) and it come as zigzag correction, we are Today in wave (c) that comes as an expanding ending diagonal which is supposed to end at 60%(5.98$ - 6.00$) of wave (a), / or wave (c) = 100% (6.60$) - 123.6% (5.98$) length (a).
### There were cases wave (c) Ended between 55%(6.11$) and 59%(6.00$) of wave (a).
Running Flat correction is the ending of W2, after that, we going to start W3 the Motive Powerful Expending Wave ever that its Target price = 26.40$ - 27.30$ at that level we also end Nen-Star Harmonic pattern to start correction of W4 to about 16$-20$ depending on How aggressive Sellers will deal with W4, at the End we will Expect to End W5 between 37$ - open Zone to 40$.
# Explosive 💣 level to make sure we completed W2 and starting W3 to Pass level 6.70$.
# Accumulation is in progress Now.
# Highly recommended for starting Buying Now.
Navitas Semiconductor Corporation (NVTS) .Stock Almost completed Wave 1 and wave 2
Ww are in Start of W3 , The Motive powerful wave that I expected to reach between 26.50 $ & 27.50 $ .
After that a small correction will be to Around 16$ - 20$ depending on Aggressive Sellers at that point .
Last 5th wave will end of 1st Wave at around 36.50$ to 40.00$ ( open Distribution Zone ) .
The whole Harmonic pattern is called after Updates [ ] .
Highly recommended for Buying.

Bull Case for wavitasRide the lead bull. This s looks to be coming in on the hundred. Makes for a greats op

Navitas Semiconductor Corporation No more Up prices , Stock starting it's C wave side in Running flat correction.
Expected 5.5$ end of correction or could be less.
Any rise means Distribution more .
Be very Careful with Stock now ... 🚷🚷🚷🚷

Navitas Semiconductor Corporation (NVTS)The stock maker decided to raise the target 🎯 for the positive head and shoulders pattern from $8.41 to $9... and at the same time form the right shoulder, meaning he sold at the top and bought from the bottom today 😎 and the stock will rise to $9 and it is not a final stop.
Continued Inverse Head & Shoulders pattern - UPDATED because of Stock Maker Mentality 😀
6.06$ - 6.98$ - Re-Accumulation Zone for Future Target prices 9$ and above .

Navitas Semiconductor Corporation Another Bullish Continue pattern formed called CUP & HANDLE .
The Target prices same as Continue Inverse Head & Shoulders .
I believe This Stock will not Stop between up waves and correction waves until reach 11.17$.
{{{{ Highly recommended for Buying }}}}} ✅️✅️✅️✅️✅️

Navitas Semiconductor Corporation Inverted Continue Head & Shoulders pattern
Target price = 8.40 $ - 11.18 $ continue raising.
Highly recommended for Buying now.

NVTS Weekly Options Outlook — June 3, 2025📉 NVTS Weekly Options Outlook — June 3, 2025
🚨 AI Consensus: Moderately Bearish into June 20 Expiry
🧠 Model Breakdown
🔹 Grok (xAI)
Bias: Moderately Bearish
Setup: 5-min price under 10 EMA, MACD weak; overbought daily band
Trade: Buy $6.00P @ $0.70 → PT $1.05, SL if NVTS > $6.10
Confidence: 65%
🔹 Claude (Anthropic)
Bias: Moderately Bearish
Setup: Consolidation phase, overbought daily RSI, falling volume
Trade: Buy $5.50P @ $0.45 → PT $0.70–$0.95, SL $0.25
Confidence: 65%
🔹 Llama (Meta)
Bias: Moderately Bearish
Setup: RSI ~41, bearish MACD; still long-term bullish
Trade: Buy $5.50P @ $0.45 → PT +50%, SL if NVTS > $6.20
Confidence: 65%
🔹 Gemini (Google)
Bias: Moderately Bearish
Setup: Rally fading, MACD histogram decaying
Trade: Buy $6.00P @ $0.70 → PT $1.05, SL $0.49
Confidence: 65%
🔹 DeepSeek
Bias: Moderately Bullish (Contrarian)
Setup: Daily trend strong; news catalysts could lift price
Trade: Buy $6.00C @ $0.70 → PT $1.00, SL $0.45
Confidence: 70%
✅ Consensus Summary
✅ Recent rally is cooling across all models (overbought RSI, fading MACD)
🧲 Max pain @ $5.50 = gravitational pull risk
📉 4 of 5 models recommend buying puts
📊 Two preferred strikes: $5.50P (Llama/Claude), $6.00P (Grok/Gemini)
📈 DeepSeek remains bullish due to news catalysts
🎯 Recommended Trade Setup
💡 Strategy: Bearish Naked Weekly Put
🔘 Ticker: NVTS
📉 Direction: PUT
🎯 Strike: $5.50
💵 Entry: $0.45
🎯 Profit Target: $0.68 (+50%)
🛑 Stop Loss: $0.25 (−45%)
📏 Size: 1 contract
📅 Expiry: 2025-06-20
⏰ Entry Timing: Market Open
📈 Confidence: 65%
⚠️ Key Risks to Monitor
🔼 News catalyst (Nvidia/Hydrogen) could reverse downside
⚠️ Low put liquidity may result in wide bid/ask spreads
📈 Break above $6.20 invalidates bearish setup
⌛ Theta decay quickens late next week — exit early if no move

Navitas Semiconductor Corporation A Formation of slope Double Bottom pattern has been rectified.
Real Rally will start after breaking up Level 7.53$.
A short term Resistance = 11.17$ ( easy breaking up with 3rd Motive Powerful wave).
Target prices Zone rectified between 16$ - 20$ , that can be extended to 26$ .

Navitas Semiconductor Corporation [ [ [ ]]
# Wave 2 , completed 😎 , Rebounding zone 👌 4.05$ - 5.00$ .
# Now, 3rd Motive Powerful wave starting 👌 🔥 💣
3rd wave is triggerd Today.
# 1st Target price = 11.17 ( point A) Harmonic Shark 🦈 pattern ( 3rd Motive wave will break up this Level easy ) .
# 2nd Target price = 20 $ .
# 3rd and Top of wave 5 = 23 $ - 26 $ .
>>>>>> Highly recommended for BUY now , Accumulation in progress <<<<<<<<

Navitas Semiconductor inc.7.68 = 88.6 % Harmonic pattern target price
Mitigation and hedging .
To be corrected.

$NVTS is up 125%, but they might not be done yet!NASDAQ:NVTS Could see more upside if...
We close the week above $4.66 Double Bottom Breakout. This would lead us to the following targets...
🎯$6📏$7.76
- Bullish cross on H5_L indicator
- Volume shelf launch with GAP
- NASDAQ:NVDA Partnership
- Small Cap
- High Short Float

Navitas - No where to go but up!This slowly reacting Gartley is finally showing some life. Could NVTS use this to get to at least $48?

Navitas Semiconductor Corporation Short term Accumulation Senario is drawn near coming days
Institutional Block way to accumulate before triggering the motive powerful wave
Target prices on Chart

Navitas Semiconductor Corporation Harmonic shap on Stock for the short period coming soon .
Target price on Chart
Buying now is your best choice 👌

Navitas Semiconductor Corporation Stock on triggering point 👉
Target prices on Chart
It could reach more than shown on chart if it is a Motive wave.
Institutional Bolck formed.

Navitas Semiconductor Corporation (Nasdaq: NVTS, NVTSW)Stock on triggering level.
Harmonic shap formed.
Target price of the stock & Harmonic shap - 20 $ .
Recommended strongly 💪 to Buy today .
