NVX @ 26 OCT 2021Text me if you have any questions/comments for me.
-----
NVX
- Previous analysis was done on 4 Oct - Suggested waiting for the next rebound wave
- Since then, the stock has tested the mid-term support and successfully rebounded above 6.60 levels
- Potential psychological resistance at $7 levels -> a test and retracement would form a double top formation
- Stock doesn’t respond to the short-term average
- R is more than 10%
- Strategy-to-buy (DYOR) – Suggest waiting for the next rebound wave
NVX trade ideas

$NVX what TF happened?/ Well it made it's meas move guys!$NVX
a big ugly, abstract, but stiull conventional bullflag, jsut made it measured move. Now byebye

NVX @ 4 OCT 2021Text me if you have any questions/comments for me.
-----
NVX
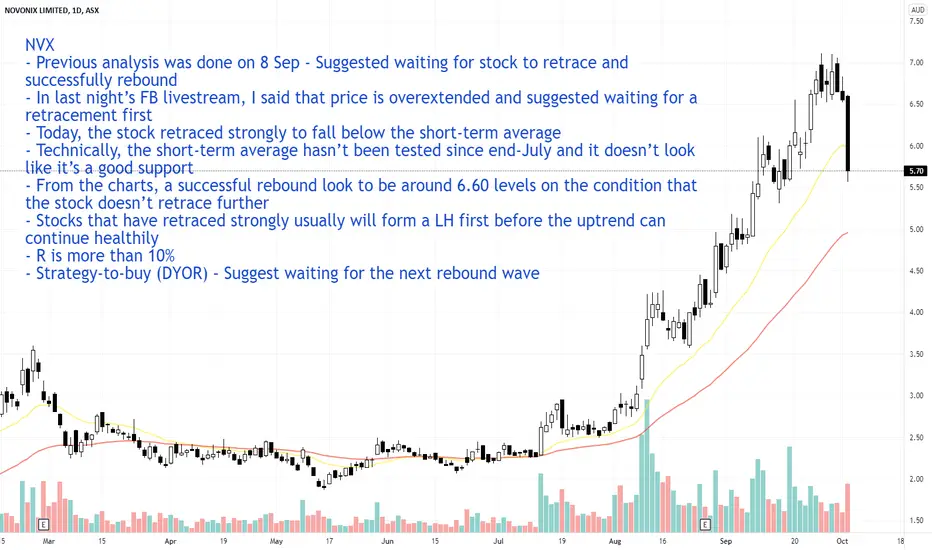
- Previous analysis was done on 8 Sep - Suggested waiting for stock to retrace and successfully rebound
- In last night’s FB livestream, I said that price is overextended and suggested waiting for a retracement first
- Today, the stock retraced strongly to fall below the short-term average
- Technically, the short-term average hasn’t been tested since end-July and it doesn’t look like it’s a good support
- From the charts, a successful rebound look to be around 6.60 levels on the condition that the stock doesn’t retrace further
- Stocks that have retraced strongly usually will form a LH first before the uptrend can continue healthily
- R is more than 10%
- Strategy-to-buy (DYOR) – Suggest waiting for the next rebound wave
NVX.ASX_Down Trendline Break_LongENTRY: 3.04
SL: 2.45
TP1: 3.60
TP2: 4.23
- ADX>20
- RSI<50,RSI<70
- Daily RS +ve
- Daily FFI +ve
- Daily MACD +ve
- Weekly RS +ve
- Weekly FFI +ve
- Weekly MACD +ve
- Accumulation signs on 13 Jul, 2 Aug and 6 Aug 2021.
- Broke down trendline on 2 Aug 2021, and retested it with rebound on volume today.


NVX - Buying Opportunity!!NVX has broken out of the bearish trendline with High Volume and a MACD Bullish Cross, showing conviction of the Bulls. This price action suggests it may go higher towards the next Resistance levels. My Tp1 is $2.75 with a potential gain of 16% and TP2 at 3.00 with a potential gain of 27%. My stoploss on this trade will be below this swing low at $2.00.
Please note these are my own notes, by no means trading advice. Please do your own research before entering into any trade.


Next week will be a move maker for novonix.If there is a move here, NVX will move next week, chart is looking good if it closers above $2.45 tomorrow. Definetly a short term trade here i believe going off the weekly and daily chart.
This stock moves very quickly as can be seen, so if next week is a mover, could definetly get to $2.80.
On watch for tomorrow and next week.

Novonix due for good news, ahead in the ev battery sector. LONGNvX has recently has two higher lows, looking to retest all time highs in coming months. MACD looking to reverse on daily. Great company with good fundamentals, DYOR. Cheers.

$NVX - Possible Elliot Wave forming - 3rd wave?Looks like reversal to upside after a decent consolidation period.
MACD crossing on Daily timeframe.


NVX - ready to bounceIn my opinion we have room to continue up here to retest the upper trendline based on historically bouncing off the 20MA. Just wait for the buy signal!
Let me know your thoughts! Message me if you like these charts!

NVX bullish wedge formation with confirmation candleGeneral trend of market is up. nice volume comi ng in on breakout of wedge/pennant. target of 3.90. stop at 2.85- 3.15 if you want to be more aggressive. for education purpose only. Do your own research

NVX Bounce off 38.2 -> Target $6.20Oversold on Daily, bounce off Fib. Looking for 1.6 extension at $6.20

Quick Scalp on NVXOn the daily it was a massive bearish candle with a bearish volume as well. So I thought ill go shot with this one, it also had a massive bull run for the past 5 days, so a pull back was due.
1 min: it did gap down and open at $3.10, waited for a pull back and got in at $3.10 with 1000 shares. Just only made about 5 ticks because I saw on the depth it was about to squeeze me out, so I
got out quickly and lucky I did.
Not my favorited trade but it will do.
Spark: On spark I saw it was going to gap down a lot so I have to be careful if it recovered. At 10.07am that’s when I got in, when I saw there was more sellers than buyers were thinning out
that’s when I got in.
Once I saw that $3 did not break and there were buyers jumping in front of it, I knew it was not going to break, that why I got out at $3.07 10.10am and the spread was so bad.


Breakaway GapWhen the price opens above a significant resistance area it is known as a Breakaway Gap.
This is a bullish signal and indicates the start of a strong trend.
Although some would argue that gaps must be filled it is important that we identify what type of gap we are looking at.
Breakaway Gaps are usually backed by a positive announcement and in this case it is;
PUREgraphite Awarded US$5.57M from the U.S.
Department of Energy (DOE) for New Technology
Development
Price is currently sitting at a major Fibonacci level of %61.8.
It is possible that we at a major resistance however a move above this level
could indicate that we are likely to reach the next target of 4.75
-BreadCharts

NVX has gone parabolic Price now outside the bollinger bands and RSI screaming overbought, but of course it doesn't mean it can't get more extreme, especially in this market. Moves like these will eventually end the same way, but make up your own mind.

BreakoutWith an extended side way trend we did eventually broke out, hold strong. Slowly with more exposure in the year 2021.Happy new year!

An update on NVX chart.I foresee, a side trend before a breakout in the near future.
Novonix has the key ingredients for it to succeed.
And poise for exponential growth in the battery industry in the future.
Novonix Bull chart signali have been following Novonix for only almost a year, regardless of BD. Novonix seems to be gaining momentum. strong company with good fundamentals and business model overall long.


$NVX does anyone know why this went up? Answer?Who cares.
Sorry but Ive made the mortal mistake of not being long on leading/trending stocks. Who cares why it went up. Just let it hit your stop to take you out after selling a few on the way up.
