$OKTA Gen AI tailwinds are not materializing as of now!- I'm a seller of NASDAQ:OKTA at $124 . Company was undervalued at 70s but has run so much without tangible materializing Gen AI tailwinds.
- Theoretically, Agentic AI should have been a great tailwind for SSO but it appears that industry is not yet focussed on security aspect of it when it come
Next report date
—
Report period
—
EPS estimate
—
Revenue estimate
—
0.76 USD
28.00 M USD
2.61 B USD
166.17 M
About Okta, Inc.
Sector
Industry
CEO
Todd McKinnon
Website
Headquarters
San Francisco
Founded
2009
FIGI
BBG001YV1SM4
Okta, Inc. engages in the provision of an identity management platform for enterprises. It operates through the United States and International geographical segments. The firm's products include single sign-on, multi-factor authentication, access gateway, API access management, authentication, adaptive MFA and lifecycle management. The company was founded by Todd McKinnon and J. Frederic Kerrest in 2009 and is headquartered in San Francisco, CA.
Related stocks

Picked Up More OKTATraders,
We’re nailing it in the stock division. Our portfolio has gained nearly 30% since the inception of our new indicator in Sept. of last year. And we’ve done that with 50% of our cash on the sidelines nearly the entire time, further reducing risk. It is amazing how I stumbled upon this new tr
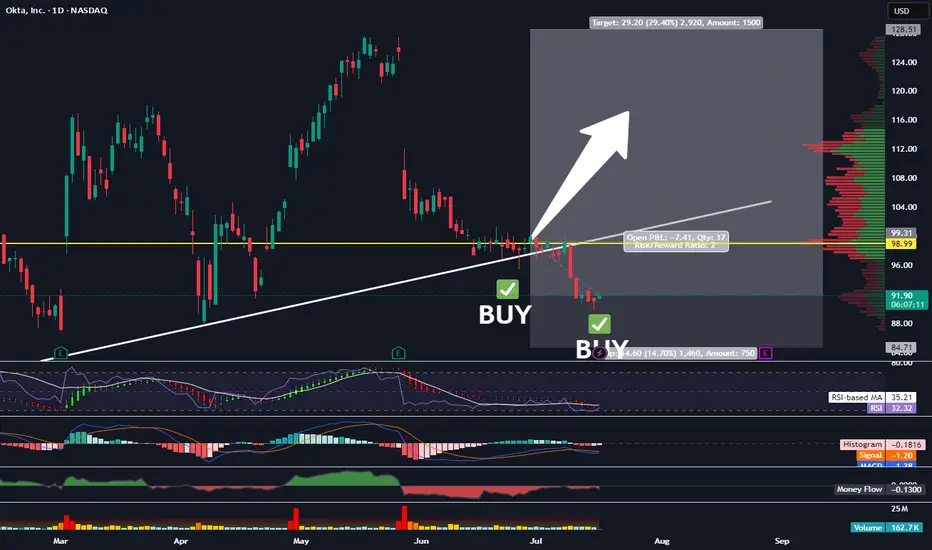
Long OKTA To 128.50 For Nearly 30% PP. 1:2 RRR.Good Afternoon Trading Fam,
We are nailing it with our stock trades since implementing my new liquidity indicator. I've got another buy signal given here on OKTA with a 1:2 rrr ratio and potential profit of nearly 30%.
On the technical side, you can see that we are just above a large liquidity blo

OKTA Trade Analysis | Technical Swing Setup with ~9% UpsideEntry: $104.43
Target: $114.76
Stop: $100.90
Risk/Reward: 2.93
This swing trade in OKTA was initiated following a pullback to key technical support levels. Price action has stabilized near the top of the Ichimoku cloud (Senkou Span A), which aligns with the daily Pivot Point around $100.58. The bul

OKTA - DAY TRADE IDEAOKTA is setting up for a day trade scalp long...perhaps an aggressive swing trade as well. The day trade is a much higher probability of success around the $98.50-$99.30
Okta's stock has seen some volatility recently. After a strong rally earlier this year, it pulled back following cautious guidanc

$OKTANASDAQ:OKTA reports earnings post-market tomorrow.
📉 Expecting intraday pressure down to the $118 zone.
➡️ Potential continuation toward $112 over the next two weeks.
🛑 Watching for support to form between $110 – $112.
30-minute chart attached for context.
#Stocks #Trading #OKTA #Earnings #Techni

Thoughts on OKTAThe OKTA chart looks like it might be for a bull run. 1st stop, $140, if that breaks then $160. Long term hold.
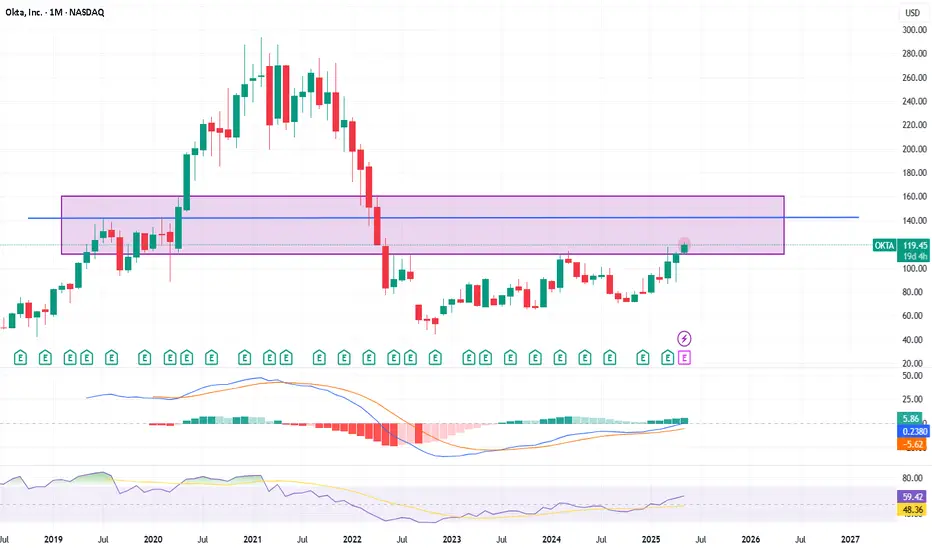
$OKTA is ready to RIP! 58% UpsideNASDAQ:OKTA was a big name I was talking about end of last year before we took a big dip in the markets...well we are back at the CupnHandle breakout level now and this trade looks ready to RIP!
Warning earnings on May 27th!
- Looking for a close on Friday above the breakout level for an entry he

Okta: Strong In a Weak Market?Okta has been quietly fighting higher, and some traders may see opportunity in its latest pullback.
The first pattern on today’s chart is the series of higher weekly lows since November. That contrasts sharply with the S&P 500 and Nasdaq-100, which have made lower weekly lows.
Second, the 50-day s

OKTA - CupnHandle Trade Setup! 61% Upside🚨 H5_L Trade Setup NASDAQ:OKTA 🚨
NOT EVERYTHING IS IN FREEFALL!
🍵BREAKOUT = 🎯$139 🎯$185
Entry: $117.29
5/1 RR - S/L: $103.55
Not in a straight line though friends!
NOT FINANCIAL ADVICE

See all ideas
Summarizing what the indicators are suggesting.
Neutral
SellBuy
Strong sellStrong buy
Strong sellSellNeutralBuyStrong buy
Neutral
SellBuy
Strong sellStrong buy
Strong sellSellNeutralBuyStrong buy
Neutral
SellBuy
Strong sellStrong buy
Strong sellSellNeutralBuyStrong buy
An aggregate view of professional's ratings.
Neutral
SellBuy
Strong sellStrong buy
Strong sellSellNeutralBuyStrong buy
Neutral
SellBuy
Strong sellStrong buy
Strong sellSellNeutralBuyStrong buy
Neutral
SellBuy
Strong sellStrong buy
Strong sellSellNeutralBuyStrong buy
Displays a symbol's price movements over previous years to identify recurring trends.
OKTA5049821
Okta, Inc. 0.125% 01-SEP-2025Yield to maturity
13.90%
Maturity date
Sep 1, 2025
OKTA5205585
Okta, Inc. 0.375% 15-JUN-2026Yield to maturity
5.00%
Maturity date
Jun 15, 2026
See all OKTA bonds
Curated watchlists where OKTA is featured.

Software stocks: US companies at our finger tips
49 No. of Symbols
See all sparks
Frequently Asked Questions
The current price of OKTA is 101.10 USD — it has increased by 3.28% in the past 24 hours. Watch Okta, Inc. stock price performance more closely on the chart.
Depending on the exchange, the stock ticker may vary. For instance, on NASDAQ exchange Okta, Inc. stocks are traded under the ticker OKTA.
OKTA stock has risen by 8.71% compared to the previous week, the month change is a 2.12% rise, over the last year Okta, Inc. has showed a 9.00% increase.
We've gathered analysts' opinions on Okta, Inc. future price: according to them, OKTA price has a max estimate of 148.00 USD and a min estimate of 75.00 USD. Watch OKTA chart and read a more detailed Okta, Inc. stock forecast: see what analysts think of Okta, Inc. and suggest that you do with its stocks.
OKTA reached its all-time high on Feb 12, 2021 with the price of 294.00 USD, and its all-time low was 21.52 USD and was reached on Aug 1, 2017. View more price dynamics on OKTA chart.
See other stocks reaching their highest and lowest prices.
See other stocks reaching their highest and lowest prices.
OKTA stock is 8.86% volatile and has beta coefficient of 1.01. Track Okta, Inc. stock price on the chart and check out the list of the most volatile stocks — is Okta, Inc. there?
Today Okta, Inc. has the market capitalization of 17.70 B, it has decreased by −3.54% over the last week.
Yes, you can track Okta, Inc. financials in yearly and quarterly reports right on TradingView.
Okta, Inc. is going to release the next earnings report on Aug 27, 2025. Keep track of upcoming events with our Earnings Calendar.
OKTA earnings for the last quarter are 0.86 USD per share, whereas the estimation was 0.77 USD resulting in a 11.69% surprise. The estimated earnings for the next quarter are 0.84 USD per share. See more details about Okta, Inc. earnings.
Okta, Inc. revenue for the last quarter amounts to 688.00 M USD, despite the estimated figure of 680.28 M USD. In the next quarter, revenue is expected to reach 711.19 M USD.
OKTA net income for the last quarter is 62.00 M USD, while the quarter before that showed 23.00 M USD of net income which accounts for 169.57% change. Track more Okta, Inc. financial stats to get the full picture.
No, OKTA doesn't pay any dividends to its shareholders. But don't worry, we've prepared a list of high-dividend stocks for you.
As of Jul 26, 2025, the company has 5.91 K employees. See our rating of the largest employees — is Okta, Inc. on this list?
EBITDA measures a company's operating performance, its growth signifies an improvement in the efficiency of a company. Okta, Inc. EBITDA is 114.00 M USD, and current EBITDA margin is 1.34%. See more stats in Okta, Inc. financial statements.
Like other stocks, OKTA shares are traded on stock exchanges, e.g. Nasdaq, Nyse, Euronext, and the easiest way to buy them is through an online stock broker. To do this, you need to open an account and follow a broker's procedures, then start trading. You can trade Okta, Inc. stock right from TradingView charts — choose your broker and connect to your account.
Investing in stocks requires a comprehensive research: you should carefully study all the available data, e.g. company's financials, related news, and its technical analysis. So Okta, Inc. technincal analysis shows the buy rating today, and its 1 week rating is buy. Since market conditions are prone to changes, it's worth looking a bit further into the future — according to the 1 month rating Okta, Inc. stock shows the buy signal. See more of Okta, Inc. technicals for a more comprehensive analysis.
If you're still not sure, try looking for inspiration in our curated watchlists.
If you're still not sure, try looking for inspiration in our curated watchlists.