Okta looks like a bullish breakout? The day charts on growth stocks back during the last crash of March 2020 looked like a very similar pattern just before forming the golden cross that lead to their recovering and marking their bottom, coming off the death cross that began their crash from all time highs. Oktas earnings have stayed consistently outperforming according to the tip ranks data shown on the day chart. If next earnings continues to do the same it could be the positive catalyst they need to fuel a recovery boost back upwards. This is a highly speculative outlook considering the uncertainty in the markets current conditions. Although if positive catalysts start showing up and their is a bounce upwards it would look all correct in the chart as far as patterns go.
OKTA trade ideas

Okta USA Sun Storm Investment Trading Desk & NexGen Wealth Management Service Present's: SSITD & NexGen Portfolio of the Week Series
Focus: Worldwide
By Sun Storm Investment Research & NexGen Wealth Management Service
A Profit & Solutions Strategy & Research
Trading | Investment | Stocks | ETF | Mutual Funds | Crypto | Bonds | Options | Dividend | Futures |
USA | Canada | UK | Germany | France | Italy | Rest of Europe | Mexico | India
Disclaimer: Sun Storm Investment and NexGen are not registered financial advisors, so please do your own research before trading & investing anything. This is information is for only research purposes not for actual trading & investing decision.
#debadipb #profitsolutions

OKTA- BULLISH SCENARIOHuge volatility for OKTA
Yesterday the price closed with almost 11% gain for the session and added 18% more in the after-hours session after the release of the earnings report.
The next major resistance is located between $ 116 and 122. If the breakout of the 2nd resistance is successful the price will be pushed to 0.382 Fibo level or $ 150
Risk Disclosure: Trading Foreign Exchange (Forex) and Contracts of Difference (CFD's) carries a high level of risk. By registering and signing up, any client affirms their understanding of their own personal accountability for all transactions performed within their account and recognizes the risks associated with trading on such markets and on such sites. Furthermore, one understands that the company carries zero influence over transactions, markets, and trading signals, therefore, cannot be held liable nor guarantee any profits or losses.

OKTADrawing Supply and Demand zones for OKTA. I love this product . It is the leader in Identity and Access management tools. It is still downtrend on Daily chart. Comments are welcome!

$OKTA with a Neutral outlook following its earnings #Stocks The PEAD projected a Neutral outlook for $OKTA after a Negative Under reaction following its earnings release placing the stock in drift D.

OKTA identity software bottoming; watch reaction @157 midboxOKTA is already basing out with RSI holding support & now slightly up while prices fall, showing some divergence. Of course it may still fall a little with max pain at the 125 red zone but right now it recovered
50% of the potential consolidation box at 157 midpoint.
Watch carefully tomorrow the reaction at 157. If It bounces up, 191 will be the target TP level. If it will be rejected down, then there will be a retest of low of box or even down to the red max pain box.
Not trading advice

OKTA ideaTrading lower in big supply zone and touch long term VWAP. Look for blowoff or resume over 13bar of buy countdown. Non good news:downgrade, sell insider and under attack of hacher..
Okta (OKTA) shares were down 8% in Wednesday trading after Raymond James downgraded the software company to market perform from strong buy.
Trading volume rose to 4.5 million shares, versus the daily average of 2.3 million shares.
Price: 152.18, Change: -14.25, Percent Change: -8.56
Christopher K Kramer, Chief Accounting Officer, on March 15, 2022, sold 1,035 shares in Okta (OKTA) for $158,275. Following the Form 4 filing with the SEC, Kramer has control over a total of 13,612 shares of the company, with 13,612 shares held directly. The market value of the direct and indirect holding, based on the transaction price, is approximately $2,081,585.
Price: 162.5, Change: +1.38, Percent Change: +0.86

OKTA at Strong SupportIf you haven`t sold OKTA because of the bearish trendline it entered:
Then you should know that the falling wedge reached its target and is now ready to bounce back from the strong support.
My price target is $174.
Looking forward to read your opinion about it.

Channel Trade w/ Surprise Potential Easiest type of trade possible: upper channel near term target 168 by Apr 1
Motivating because industry/sector is heating up.
Not advice of financial type or whatevs.

OKTA Falling Wedge PatternIf you haven`t sold earlier:
Then you should know that OKTA is heading to the $132 support.
It should bounce from that strong support.

OKTA Falling Wedge and Losses Exceeding ExpectationsOKTA is bearish from both fundamental and technical perspectives.
The falling wedge has a price target of $140 before a bounce and the company said billings rose 91% to $603 million vs. estimates of $497 million.
Since the earnings are negative, 266Mil in 2021 and the Market Cap is high, 28.418Bil, OKTA is still a growth stock from which investors have high expectations.
When investors see weaker forecasts or expenses increase, on rising interest rates, they are tempted to sell.
In this case, my price target is the $140 support.
Looking forward to read your opinion about it.

OKTA headed for a retest of the range?OKTA got crushed trying to breakout of the narrowing range. And fell out of it. It may have finally found support around its March 30 2021 low. It closed Wednesday just at the 100% level($219.51) of this inverse extension. Friday it not only gapped up slightly while the rest of the market sold off it retested and held the $219.51 level and closed the day at $222.69. I’m looking for OKTA to push back up to test the $230.80 level and beyond to try breaking back into this triangle. If it can do that I will follow these levels up to try for another breakout.

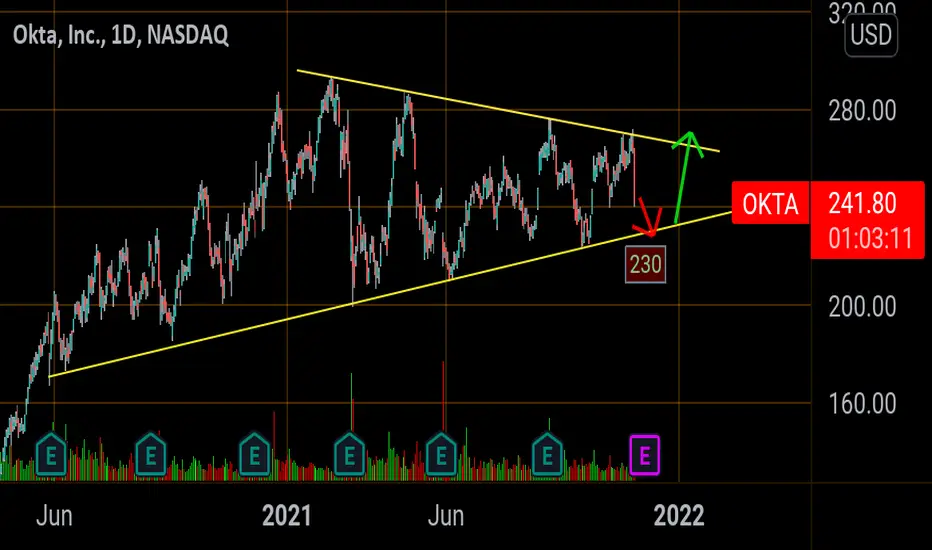
Okta Triangle . Short then go longShowing a symmetrical triangle here . Looks to be headed back to support at around 230..
from there I think okta would rally into earnings and possibly breakout..
If it does breakout this would send the stock into 320+.
Long $OKTA - Ready for next leg upSince IPO Okta has maintained it's growth and it has done that in phases. Looking at weekly chart it looks promising and consistent in 4 year long uptrend.
In 2021 it has mostly consolidated and absorbed last years growth and gearing up for next phase of growth.
Okta has earnings on Dec 1, be careful about position sizing. Try to avoid earnings volatility.

Okta Analysis 18.11.2021Hello Traders,
welcome to this free and educational analysis.
I am going to explain where I think this asset is going to go over the next few days and weeks and where I would look for trading opportunities.
If you have any questions or suggestions which asset I should analyse tomorrow, please leave a comment below.
If you enjoyed this analysis, I would definitely appreciate it, if you smash that like button.
Thank you for watching and I will see you tomorrow!

OKTA ready to runOKTA might be a good swing candidate, been consolidating for 4 months in $30 range. Might finally break and go for it.

Flagging on its 5-Year- BullishOKTA really catching my eye here, flagging on its 5-year chart- Just some support and resistance levels to keep an eye on along with some RSI-based supply and demand zones- Bullish and will be looking for a breakout
- EMA's curling
- Bollinger Bands squeezing on the weekly timeframe (See Chart Below)
- Slight bullish divergence on the RSI on shorter timeframes
PT1- $264.79
PT2- $267.89
PT3- $271.76
PT4- $274.67

$OKTA weekly chart. OKTA holding the trendline$OKTA weekly chart. OKTA held where it needed to on the trendline.

Rectangle Symmetrical Triangle ABC Bullish Double BottomOKTA is riding Daily RSI overbought status with RSI on 80, but is just underneath. It is not overbought on weekly of monthly RSI. Price is outside the top bollinger band with the SMA set on 80 which shows extreme buying pressure and probably overbought status. Price will return to the interior of the bands eventually.
Prior ugly top.
I placed the resistance level on the chart that corresponds to the rectangle. There are other levels of resistance noted.
Golden cross looming. Many describe a golden cross (bullish moving average crossover) as a cross of the 50 SMA up and through the 200 SMA. It is very close to a crossover here. The 50 has already crossed through the 100. The 20, 50 and 100 SMA are tangling which is often considered bullish. There are bearish Ws which seem to have corrected and last formation in the ABC bullish pattern was a bullish crooked M. (second peak being higher than the first in this M)
Price has been in a large rectangle with the bottom trendline being support and the top one being resistance. Price would need to break the top trendline of the rectangle to meet targets 2. Price also broke up from a symmetrical triangle. Symmetrical triangles are neutral until a trendline is broken with a trend in that direction.
Lots of green right now with 2 small gaps under price. Gaps can serve as a source of support.
Last candle is a doji, a candle of indecision. Lots point to a pull back of some sort, but you just never know. Lots of green candles representing buyers, but buyers do become sellers )o:
No recommendation.
Very busy bullish chart that is slap full of bullish patterns and crossovers of moving averages.
Sometimes it is best to hold your horses and let them drink some water and wait for a good long entry level.

OKTA weekly curve breakoutGo long at the. weekly curve breakout, very explosive patter here i suggest shares or 2023 leaps


OKTA weekly curve breakoutGo long okta, weekly curve breakout could be explosive. Grandpa style long

OKTA go longGo long OKTA at the 300MA, grandpa style breakout. Reminds me of aapl before it broke out
