OMEX Wedge Breakout Setup!
📊 **Trade Setup Alert: OMEX**
🚀 **Entry:** $0.6411
🛡️ **Stop Loss:** $0.5543
🎯 **Targets:**
- **T1:** $0.7380
- **T2:** $0.8515
🔍 Breakout from a descending wedge pattern on the 30-min chart with bullish momentum! Volume is picking up, suggesting potential upward continuation. Favorab
Next report date
—
Report period
—
EPS estimate
—
Revenue estimate
—
0.73 USD
15.66 M USD
768.68 K USD
26.48 M
About Odyssey Marine Exploration, Inc.
Sector
Industry
CEO
Mark D. Gordon
Website
Headquarters
Tampa
Founded
1994
FIGI
BBG000JJVJF5
Odyssey Marine Exploration, Inc. is a deep-ocean exploration pioneer that provides access to critical mineral resources. The company uses innovative methods and cutting-edge technology to discover, validate and develop subsea mineral deposits in an environmentally and socially responsible manner. Its growing project portfolio includes different mineral sets in various jurisdictions around the world. The firm focuses on the ExO Phosphate, Lihir Gold projects and Cook Island Nodule Exploration. The company was founded by Gregory P. Stemm and John C. Morris in 1994 and is headquartered in Tampa, FL.
Related stocks

Odyssey Marine Exploration Soars on NAFTA Arbitration VictoryOdyssey Marine Exploration (NASDAQ: OMEX) has reported a major win in its ongoing arbitration case with the United Mexican States under Chapter Eleven of the North American Free Trade Agreement (NAFTA). The International Centre for Settlement of Investment Disputes (ICSID) awarded Odyssey $37.1 mill

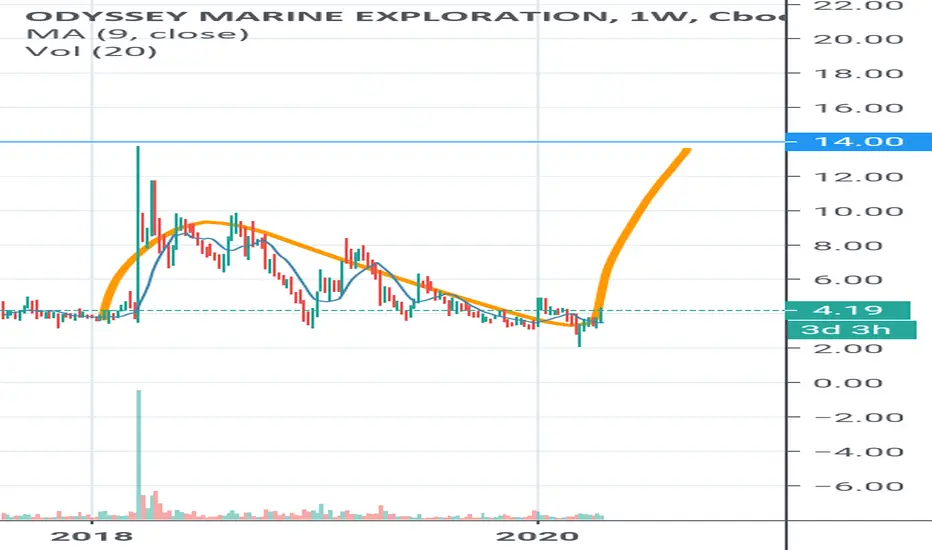
ODYSSEY MARINE Stock Chart Fibonacci Analysis 031224Trading Idea
1) Find a FIBO slingshot
2) Check FIBO 61.80% level
3) Entry Point > 3.9/61.80%
1) Find a FIBO slingshot
2) Check FIBO 423.60% level
3) Hit the top = 57/423.60%
Chart time frame : D
A) 15 min(1W-3M)
B) 1 hr(3M-6M)
C) 4 hr(6M-1year)
D) 1 day(1-3years)
Stock progress : A
A) Keep ris

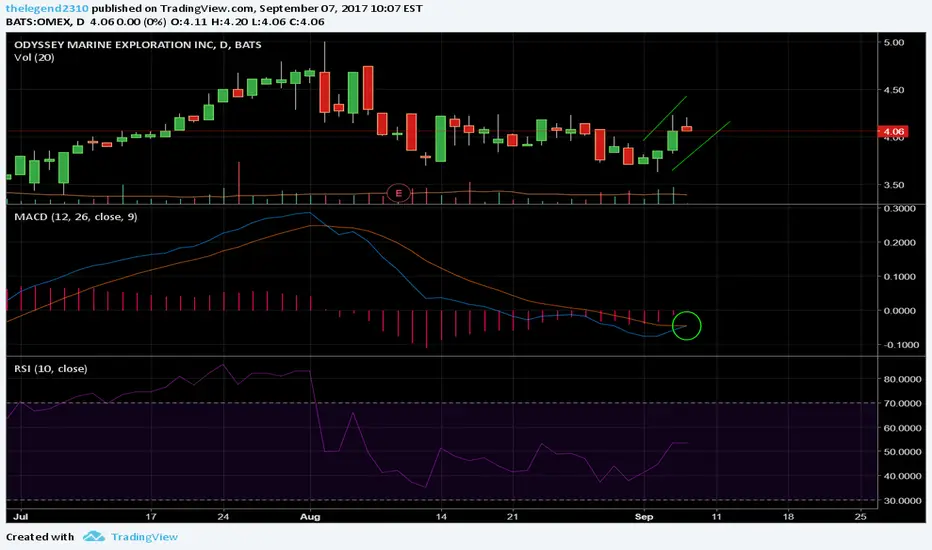
OMEX Pull Back to 4 months #Rectangle #Breakout?OMEX broke out on Thursday from its 4 months rectangle consolidation pattern. Had a wide range breakout bar and pulled back into Friday session.


See all ideas
Summarizing what the indicators are suggesting.
Oscillators
Neutral
SellBuy
Strong sellStrong buy
Strong sellSellNeutralBuyStrong buy
Oscillators
Neutral
SellBuy
Strong sellStrong buy
Strong sellSellNeutralBuyStrong buy
Summary
Neutral
SellBuy
Strong sellStrong buy
Strong sellSellNeutralBuyStrong buy
Summary
Neutral
SellBuy
Strong sellStrong buy
Strong sellSellNeutralBuyStrong buy
Summary
Neutral
SellBuy
Strong sellStrong buy
Strong sellSellNeutralBuyStrong buy
Moving Averages
Neutral
SellBuy
Strong sellStrong buy
Strong sellSellNeutralBuyStrong buy
Moving Averages
Neutral
SellBuy
Strong sellStrong buy
Strong sellSellNeutralBuyStrong buy
Displays a symbol's price movements over previous years to identify recurring trends.
Curated watchlists where OMEX is featured.

Frequently Asked Questions
The current price of OMEX is 1.41 USD — it has increased by 9.30% in the past 24 hours. Watch Odyssey Marine Exploration, Inc. stock price performance more closely on the chart.
Depending on the exchange, the stock ticker may vary. For instance, on NASDAQ exchange Odyssey Marine Exploration, Inc. stocks are traded under the ticker OMEX.
OMEX stock has fallen by −12.42% compared to the previous week, the month change is a 25.89% rise, over the last year Odyssey Marine Exploration, Inc. has showed a −65.01% decrease.
OMEX reached its all-time high on May 21, 2007 with the price of 113.45 USD, and its all-time low was 0.27 USD and was reached on Apr 7, 2025. View more price dynamics on OMEX chart.
See other stocks reaching their highest and lowest prices.
See other stocks reaching their highest and lowest prices.
OMEX stock is 13.18% volatile and has beta coefficient of 2.89. Track Odyssey Marine Exploration, Inc. stock price on the chart and check out the list of the most volatile stocks — is Odyssey Marine Exploration, Inc. there?
Today Odyssey Marine Exploration, Inc. has the market capitalization of 44.18 M, it has increased by 24.09% over the last week.
Yes, you can track Odyssey Marine Exploration, Inc. financials in yearly and quarterly reports right on TradingView.
Odyssey Marine Exploration, Inc. is going to release the next earnings report on Aug 8, 2025. Keep track of upcoming events with our Earnings Calendar.
OMEX net income for the last quarter is 2.24 M USD, while the quarter before that showed −5.00 M USD of net income which accounts for 144.82% change. Track more Odyssey Marine Exploration, Inc. financial stats to get the full picture.
No, OMEX doesn't pay any dividends to its shareholders. But don't worry, we've prepared a list of high-dividend stocks for you.
As of Aug 3, 2025, the company has 11 employees. See our rating of the largest employees — is Odyssey Marine Exploration, Inc. on this list?
EBITDA measures a company's operating performance, its growth signifies an improvement in the efficiency of a company. Odyssey Marine Exploration, Inc. EBITDA is −9.52 M USD, and current EBITDA margin is −1.54 K%. See more stats in Odyssey Marine Exploration, Inc. financial statements.
Like other stocks, OMEX shares are traded on stock exchanges, e.g. Nasdaq, Nyse, Euronext, and the easiest way to buy them is through an online stock broker. To do this, you need to open an account and follow a broker's procedures, then start trading. You can trade Odyssey Marine Exploration, Inc. stock right from TradingView charts — choose your broker and connect to your account.
Investing in stocks requires a comprehensive research: you should carefully study all the available data, e.g. company's financials, related news, and its technical analysis. So Odyssey Marine Exploration, Inc. technincal analysis shows the buy rating today, and its 1 week rating is buy. Since market conditions are prone to changes, it's worth looking a bit further into the future — according to the 1 month rating Odyssey Marine Exploration, Inc. stock shows the sell signal. See more of Odyssey Marine Exploration, Inc. technicals for a more comprehensive analysis.
If you're still not sure, try looking for inspiration in our curated watchlists.
If you're still not sure, try looking for inspiration in our curated watchlists.