OPEN trade ideas

$OPEN $50 mark to come- significant break-out volume after nice months of consolidation.
- higher high, higher low --> uptrend has never been broken
- nice company (I did do some research on it)
- recommend play: 40c April sounds good.


OPEN: NEW SWING LONG SET UPOPEN:
Low risk buy at channel bottom.
Let's see if we can reach the top of the channel as indicated on the chart.
Trade safe.

$OPEN OpenDoor Technology Breakout Targets
The stock finally broke out from its consolidation phase on good volume and sets
up a rally to much higher levels in the days to come.
Targets as per the chart ranging from short to medium term trades.


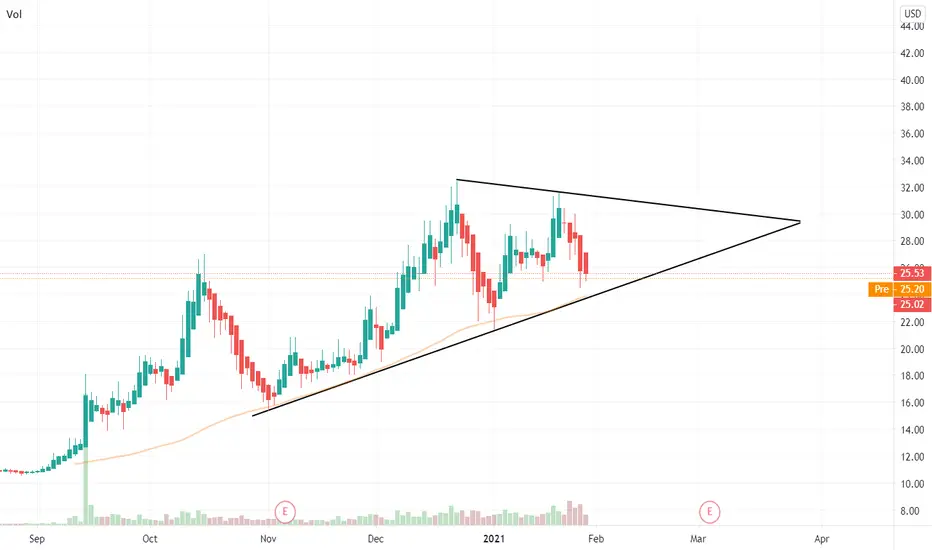
Symmetrical TriangleSymmetrical Triangles can break up or down.
This one has an uptrend preceding it but S TRiangles can form in either trend or in a range. Price should touch trendlines at least 5 times, 2 touches to one trendline and 3 to the other. One trendline is support and one is R. Triangles that break on heavy volume perform better
Newer stock on the market so not a ton of chart info. Low is 10.55 so has made quite a move up already.
NV was high at the bottom or at the beginning, but has slacked off now. OBV is very high.
Not a recommendation
Opendoor Technologies Inc. operates a digital platform for residential real estate in the United States. Its platform enables consumers to buy and sell a home online. The company was founded in 2014 and is headquartered in San Francisco, California.
OPEN 02-02-2021 LongAsset and Time frame -OPEN,4H
Entry Price -27.8778
Exit(Stop Loss) -26.25
Exit(Take Profit) -33.27
Technical Analysis -Price moved out from confirmed up-trending channel, and now it's returning after failing to reach oversold on the RSI, crossing the 50 & 100 MA with an engulfing bullish candle
I would like to hear your opinions and what can I do to improve, many thanks

OPEN - February 9, 2021No entry on OPEN but looking for sideways movements and consolidation towards this trendline. If not, sitting out on this trade.


Opendoor Is the Future Amazon of the $1.6 Trillion Real EstateOpendoor is an e-commerce platform where consumers can buy, sell and view homes online. For all intents and purposes, Opendoor is the future Amazon of the real estate market — and this $1.6 trillion market is ripe for significant and widespread digital disruption over the next 10 to 15 years. Amid this disruption, Opendoor will grow by leaps and bounds, and IPOB stock will soar like AMZN stock has soared over the past 10 to 15 years.
Credit: Luke Lango, InvestorPlace Senior Investment Analyst

Long | OPENNASDAQ:OPEN
Possible Scenario: LONG
Evidence: Price Action
This is my idea and could be wrong 100%.

$OPEN – Rising Three Method$OPEN – Rising Three Method
Mapping my plan for $OPEN. I see the candles are forming a bullish Rising Three method. Breakout of wedge, support by volume profile and EMA. Positive/neutral technicals and oscillators. Curling MACD. RSI and volume are a bit high so maybe a small pull back.

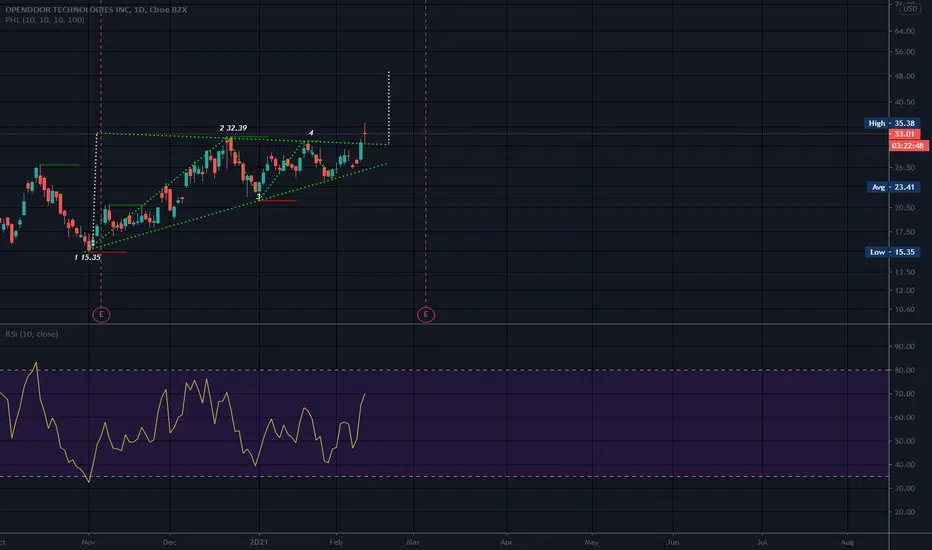
OPEN - Wave CountCount on chart.
This last ABC may be even the first 1-2. Both cases the future is clear.

I like OPEN here, looks very bulish.Macd is about to cross over and when it does my first target is $31 and my second target is $36. Good looking chart, trading in an upper trend.


$OPEN. Newer highs soon?$OPEN has been trading in a wave pattern that's been easy to spot and enter during the previous 2 times they happened. The price squeezes into the 55ema, and stochastic rsi is below 30 is the buy signal before the next leg up (which it just flashed today).
Applied wave theory to the chart. Price targets on the chart. Not financial advice.

$40 PriceTarget OPENOpendoor, after merger, ascending triangle has formed on the daily, Im looking for dip buying opportunities with a solid price target of $40.

$OPEN Hi guys i have been tracking open for while, might be able to grab shares here w amazing risk reward, watch 618% might bounce hard there, if my triggers don't get reached no harm or loss but we will catch monsters weekly w patience

Open long With the MACD crossing green, bullish divergence on the rsi. I'm in this play for a long play.


OPEN Setting Up For Strong Bounce Off Major SupportToday, OPEN has dropped to its major trendline support (purple line) as well as its 50-day SMA (blue line). There is a high likelihood that OPEN will rebound to previous highs because (I) the stock has very rarely fallen below its 50-day SMA, and (II), it has rebounded off the trendline support multiple times in the past.
