Lidar Supercycle Next?Ouster is up almost 500% from the lows, after an absolute capitulation from the highs. The chart shows the end of a 5 Wave structure, followed by almost three years of sideways consolidation. We are now breaking out of the range, and in the midst of a pullback.
The revenue growth has resurrected the stock from the depths of hell. Margin expansion is being led by the demand for LIDAR technology, primarily in EV, industrial automation, drone technology.
This stock could be a big winner, especially after the Big Beautiful Bill - with a big increase in defense budget particularly in drones.
Not financial advice, do what's best for you.
OUST trade ideas

OUST Continuation PatternOUST is steadily rising especially after Earning reports came out in May. 5EMA can be checked time to time even put an alert on it. It can behave as support. I believe this strong move will continue. It just recently brokeout with gap.

Is Digital LiDAR the Eye of Autonomy's Future?Ouster, Inc. (NYSE: OUST), a key player in the small-cap technology landscape, recently experienced a significant boost in its share price following a crucial endorsement from the United States Department of Defense (DoD). This approval of Ouster's OS1 digital LiDAR sensor for unmanned aerial systems (UAS) validates the company's technology. It highlights the growing importance of advanced 3D vision solutions in both defense and commercial sectors. Ouster positions itself as a foundational enabler of autonomy, with its digital LiDAR distinguishing itself through enhanced affordability, reliability, and resolution compared to traditional analog systems.
The DoD's inclusion of the OS1 sensor within its Blue UAS Framework represents a strategic victory for Ouster. This rigorous vetting process ensures supply chain integrity and operational suitability, making the OS1 the first high-resolution 3D LiDAR sensor to receive such an endorsement. This approval significantly streamlines procurement for various DoD entities, promising expanded adoption beyond Ouster's existing defense engagements. The OS1's superior performance in weight, power efficiency, and rugged conditions further underscores its value in demanding applications.
Looking ahead, Ouster actively develops its next-generation Digital Flash (DF) Series, a solid-state LiDAR solution poised to revolutionize automotive and industrial applications. By eliminating moving parts, the DF series promises enhanced reliability, longevity, and cost-efficient mass production, addressing critical needs for autonomous driving and advanced driver-assistance systems (ADAS). This forward-looking innovation, combined with the recent DoD validation, firmly establishes Ouster as a pivotal innovator in the rapidly evolving landscape of autonomous technologies, driving its ambition to capture a substantial share of the $70 billion total addressable market for 3D vision.

Revenue growth nine consecutive quarters Ouster’s global partner network spans over 50 countries, supporting approximately 600 customers with applications in autonomous vehicles, robotics, drones, mapping, defense, and smart cities. Ouster has been getting lots of attention lately 230k 20 call 1/16/26 I'm wondering if someone knows there's an announcement coming this year that will get them ABOVE $20. Great growth stock huge partners here are some notable ones.
Anduril Industries: weapons/defense tech *
Komatsu: construction mining *
Vecna Robotics: warehouses
NVDIA: integration/traffic ***
Forterra, Textron, Field AI, and U.S. Army: vehicles
Google Maps, Apple Maps, Oshkosh Defense, John Deere: sensory
Amazon Robotics: Ouster’s LiDAR sensors are reportedly used in Amazon’s Proteus robots, described as part of a significant order, though not officially published. ***
Right at monthly resistance now 15$ is a strong resistance. Any pull back to $10 ish would make great buying opportunity I'm long from earlier this week July 14C / 16C Aug 17C looking to add BUT I'm also trading these the daily RSI is at 75 nearing overbought, weekly has room to run at 64 monthly is at 50 which it could reject momentarily from. Either way great company to DCA shares still under 1B market cap!

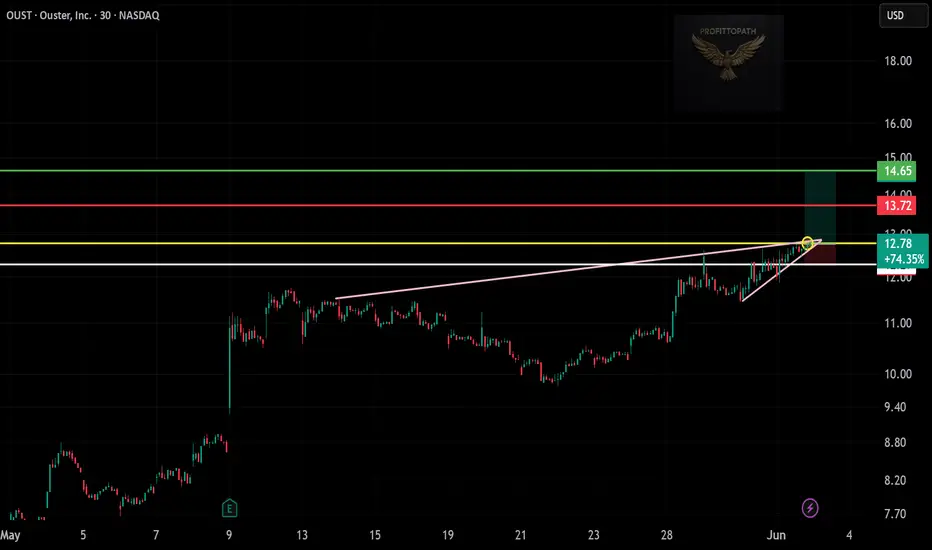
OUST Breakout Alert — Eyeing $14.65+ from Tight Coil
📝 Description (General & Professional):
Ticker: NASDAQ:OUST
Timeframe: 30-Min Chart
Trade Type: Long (Breakout Setup)
OUST has been consolidating just below key resistance and has now broken out of a tight ascending wedge. The price action shows strong upward momentum following a series of higher lows and a breakout above confluence resistance around $12.78.
A breakout candle has confirmed strength above this zone. With volume expanding and structure intact, this setup offers a clean risk-to-reward play.
✅ Trade Plan:
Entry: $12.78
Stop-Loss: $13.72 (above recent consolidation high)
Target: $14.65
Risk/Reward: ~1:2+
🔍 Key Technicals:
Rising wedge breakout (bullish)
Clean price compression followed by expansion
Strong structure of higher lows leading into resistance
Target derived from measured move projection and past rejection zone
⚠️ What to Watch:
Watch for retest of $12.78 — could offer a second entry
Volume should confirm breakout continuation
Momentum over $13.72 opens path toward $14.65+
📈 Chart by ProfittoPath
Sharing educational setups, swing trade breakdowns, and price action strategies.
New Setup: OUSTOUST: I like this stock going into tomorrow. It has two patterns, the Cup-and-Handle, and Inverse Head-and-Shoulder pattern. Cheers!

OUST – Ouster, Inc. – 30-Min Bullish Breakout Setup!
📈 🚀
🔹 Asset: OUST (NASDAQ)
🔹 Timeframe: 30-Min Chart
🔹 Setup Type: Symmetrical Triangle + Breakout Zone
📊 Trade Plan (Long Position)
✅ Entry Zone: Above $11.30 (breakout from triangle + horizontal resistance reclaim)
✅ Stop-Loss (SL): Below $10.85 (trendline and demand zone support)
🎯 Take Profit Targets
📌 TP1: $11.75 – Minor resistance / previous rejection
📌 TP2: $12.00 – Round number & key resistance
📌 TP3: $12.40 – Major resistance and upper green zone
📊 Risk-Reward Ratio Calculation
📉 Risk:
$11.30 (Entry) - $10.85 (SL) = $0.45 risk per share
📈 Reward to TP1:
$11.75 - $11.30 = $0.45 (1:1 R/R)
📈 Reward to TP2:
$12.00 - $11.30 = $0.70 (1.55:1 R/R)
📈 Reward to TP3:
$12.40 - $11.30 = $1.10 (2.44:1 R/R)
🔍 Technical Analysis & Strategy
📌 Symmetrical Triangle: Price is consolidating with higher lows and lower highs, squeezing toward breakout point (yellow circle)
📌 Breakout Watch: A breakout above the triangle with volume = momentum trigger
📌 Volume: Light so far, watch for confirmation on breakout
📌 Support: Clean trendline support near $10.85 zone
⚙️ Trade Execution & Risk Management
📊 Entry Confirmation: Wait for a 30-min candle close above $11.30 with volume
📉 SL Management: Place SL below triangle support at $10.85
🔁 Trailing Stop Strategy:
✔ Move SL to breakeven at TP1
✔ Trail above $11.50 once TP2 is hit
💰 Profit Booking Strategy
✔ Book 50% at TP1 ($11.75)
✔ Let the rest ride to TP2 and TP3
✔ Adjust SL progressively to lock in gains
⚠️ Invalid Setup Conditions
❌ Breakdown below $10.85 trendline = pattern failure
❌ Low-volume breakout = avoid fakeout entries
🚀 Final Thoughts
✔ Beautiful triangle squeeze + demand zone
✔ Entry near breakout zone offers solid R/R
✔ If volume confirms, this can push toward $12.40+

Stock Analysis: OUST (Ouster, Inc.) – 30-Min Chart!📊
🚀 Setup Type: Bullish Breakout – Trendline Break + Volume Surge
✅ Trade Plan: Long Position
🔔 Entry & Exit Plan
✅ Entry Zone: Above $11.05 (Breakout Confirmation)
🛡️ Stop-Loss (SL): Below $10.45 (Recent Support Zone)
🎯 Take Profit Targets:
📌 TP1: $11.82 – Previous Resistance
📌 TP2: $12.78 – Measured Move / Upside Gap Level
📊 Risk-Reward Breakdown
🔻 Risk: $11.05 – $10.45 = $0.60
📈 Reward to TP1: $11.82 – $11.05 = $0.77 → 1:1.28 R/R
📈 Reward to TP2: $12.78 – $11.05 = $1.73 → 1:2.88 R/R
✅ Solid risk-to-reward structure with high volume momentum!
🔍 Technical Breakdown
📌 Breakout from Rising Wedge: Price surged and broke above resistance
📌 High Volume Surge: Strong buying pressure confirms breakout strength
📌 Resistance Flip: $11.05 key breakout level—now acting as support
📌 Uptrend Momentum: Series of higher lows and bullish follow-through
🛠️ Trade Execution Plan
✔ Wait for Confirmation: 30-min candle close above $11.05
✔ Break-even Strategy: Move SL to entry once TP1 ($11.82) is reached
✔ Partial Profit Booking:
▫️ Take 50% at TP1
▫️ Let rest ride to TP2 ($12.78)
✔ Adjust SL Upward as price moves favorably
⚠️ Risk Factors
❌ False Breakout Risk: Monitor volume and trend continuation
❌ Overextension: Price is already up 30%—watch for exhaustion pullbacks
🚀 Final Thoughts from ProfittoPath
✔ Strong momentum-backed breakout with clean structure
✔ Ideal for quick momentum trades with risk management
✔ Potential for continuation if $11.05 holds as support
💡 Trade smart, manage risk, and stay focused on execution.
🔗 #OUST #BreakoutTrade #MomentumStocks #ProfittoPath #TradingView

OUST Ouster Options Ahead of EarningsAnalyzing the options chain and the chart patterns of OUST Ouster prior to the earnings report this week,
I would consider purchasing the 20usd strike price Calls with
an expiration date of 2026-1-16,
for a premium of approximately $0.75.
If these options prove to be profitable prior to the earnings release, I would sell at least half of them.

Oust (Long)I am bullish on Oust, which I believe that the chart analysis clearly state the technical analysis behind my sentiment. The target is between 26-33 USD. Oust is planning to release Q4 earnings on March 18th, which is also expected to be a good report given the fact that they announced in Q3 the signing of "the largest order" in their history without naming the client or the value of the contract. In my opinion Fundamental analysis is a safety net for the technical analysis, which seems to align quiet well with the technical analysis provided.
