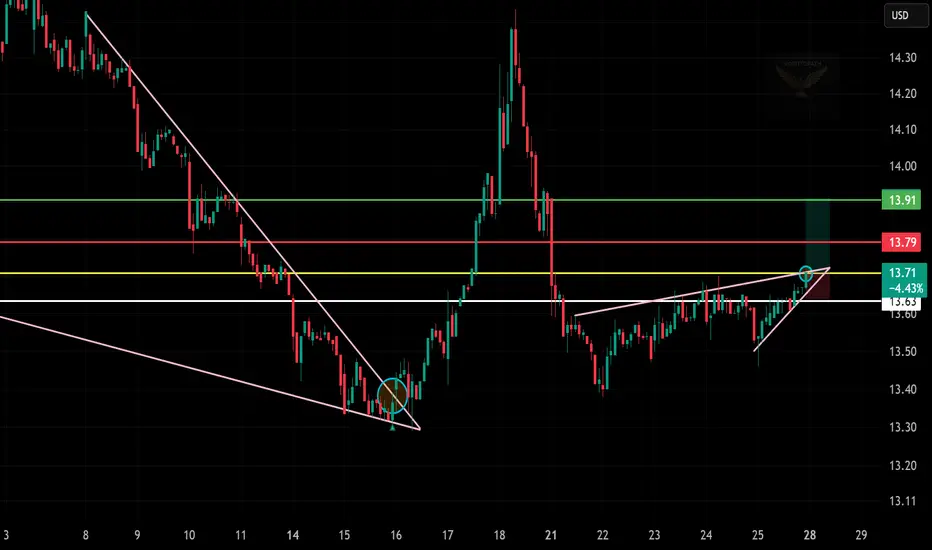
PAX Long Trade Setup!🟢 🚀
📈 Breakout above wedge confirms bullish strength.
🔁 Support reclaimed at $13.83 — clean entry.
🟩 Long position active after trendline touch.
🛑 Stop set below breakout zone at $13.60.
🎯 Target locked at $14.06 resistance zone.
PAX trade ideas
Patria Investments Limited Quote | Chart & Forecast SummaryKey Indicators On Trade Set Up In General
1. Push Set Up
2. Range Set Up
3. Break & Retest Set Up
Notes On Session
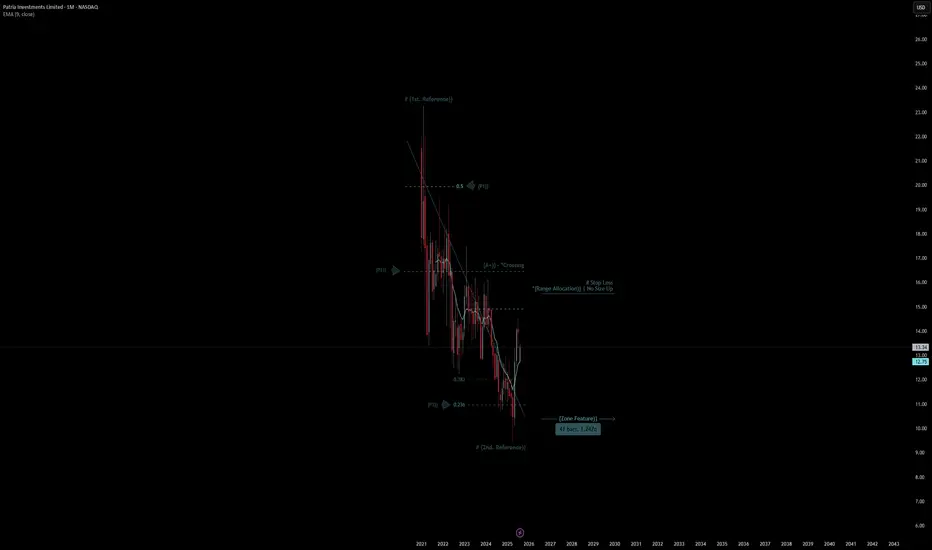
# Patria Investments Limited Quote
- Double Formation
* # (1st. Reference)) At 23.00 USD| Subdivision 1
* (A+)) - *Crossing | Completed Survey
* 41 bars, 1.247d | Date Range Method - *(Downtrend Argument))
- Triple Formation
* (P1)) / (P2)) & (P3)) | Subdivision 2
* Monthly Time Frame | Trend Settings Condition | Subdivision 3
- (Hypothesis On Entry Bias)) | Regular Settings
* Stop Loss Feature Varies Regarding To Main Entry And Can Occur Unevenly
- Position On A 1.5RR
* Stop Loss At 15.00 USD
* Entry At 13.00 USD
* Take Profit At 10.00 USD
* (Downtrend Argument)) & No Pattern Confirmation
- Continuation Pattern | Not Valid
- Reversal Pattern | Not Valid
* Ongoing Entry & (Neutral Area))
Active Sessions On Relevant Range & Elemented Probabilities;
European-Session(Upwards) - East Coast-Session(Downwards) - Asian-Session(Ranging)
Conclusion | Trade Plan Execution & Risk Management On Demand;
Overall Consensus | Sell
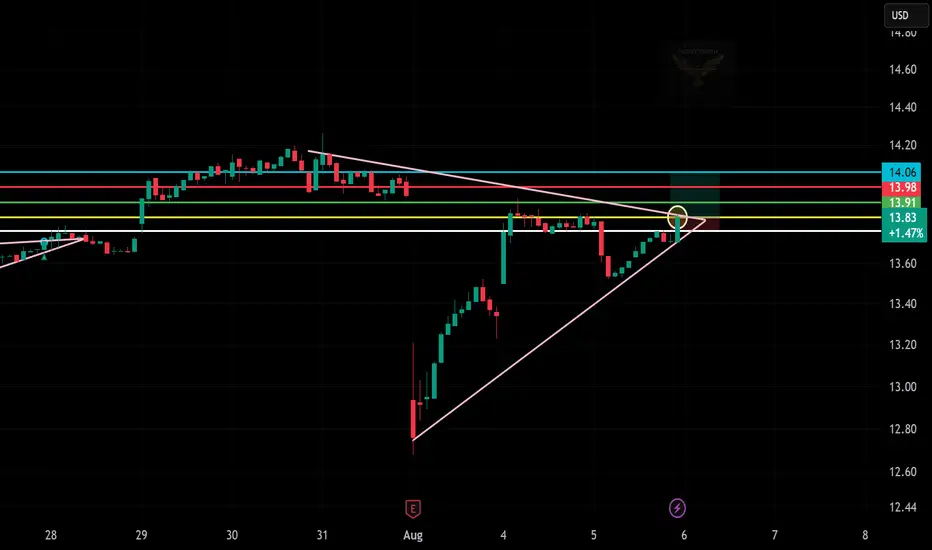
Long Trade Setup on $PAX!📈
Entry: $13.71
Stop Loss: $13.59
Target: $13.91
Pattern: Ascending Triangle Breakout
Risk-Reward: ~1.7R
Key Level to Watch: $13.78 (possible resistance)
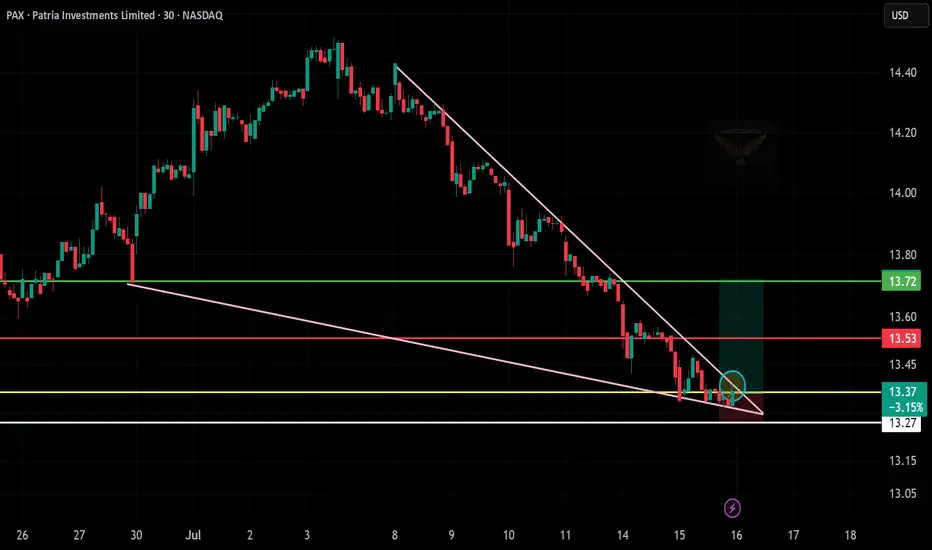
PAX Falling Wedge Breakout – Long Trade Setup
🧠 Chart Analysis Summary:
Pattern: Falling wedge breakout spotted — a classic bullish reversal pattern.
Current Price: $13.37
Support Zone:
$13.27 (white line, holding support)
Breakout Confirmation: Price is pushing out of the wedge with a small green move (circle).
📊 Key Levels:
Entry Zone: $13.35–$13.40
Target 1: $13.53 (red line – short-term resistance)
Target 2: $13.72 (green line – wedge target zone)
Stop-Loss: Below $13.25
🎯 Trade Idea (Bullish Bias):
Entry: $13.35–13.40
Target: $13.72
Stop-Loss: $13.25
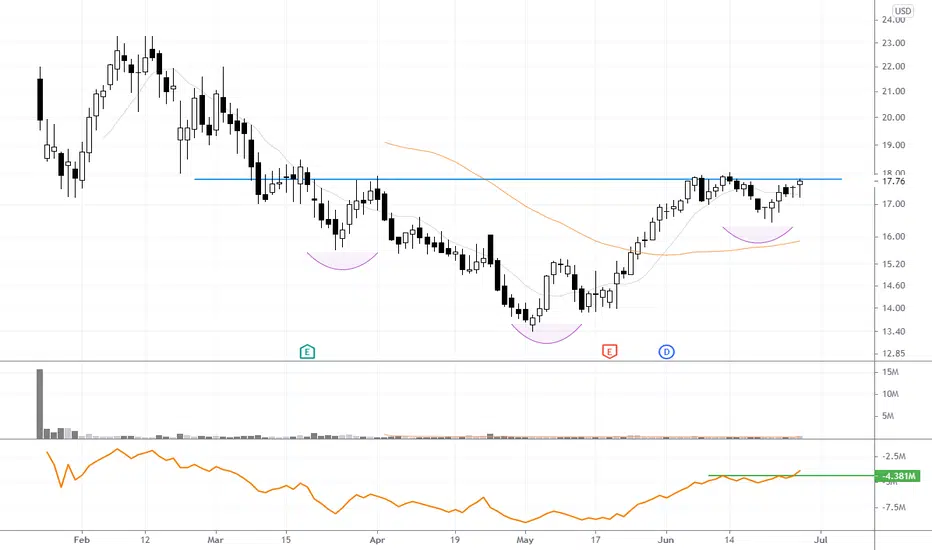
US Stock In Play: $PAX (Patria Investment Limited)5 months Ascending triangle, mid term cup and handle pattern formation. +300% in sequential quarter sales growth. only concerning is low institutional sponsorship, and there doesn't seem to be pick up interest in institutional interest.

$PAX IPO Head and Shoulders Bottom$PAX IPO head and shoulders base bottom. I like how this is setting up with OVB pocking its head into new high ahead of price.