PAYS - Shut Up and Play The SetupNot that I feel super bullish but market breadth and market leaders NASDAQ:NVDA NASDAQ:SMCI NYSE:CPNG all pointing in that direction.
I suppose it's a shut up and play the setup moment for me NASDAQ:PAYS held up well during all this mess. She got high and tight and has the fundamental fue
Key facts today
Next report date
—
Report period
—
EPS estimate
—
Revenue estimate
—
0.11 USD
3.82 M USD
58.38 M USD
38.11 M
About Paysign, Inc.
Sector
CEO
Mark R. Newcomer
Website
Headquarters
Henderson
Founded
1995
FIGI
BBG000BR52Q9
PaySign, Inc. engages in the provision of prepaid card programs and processing services for corporate, consumer & government applications. It specializes in corporate incentive products, payroll cards, general purpose re-loadable cards, and travel cards. The firm markets prepaid solutions through its PaySign brand. The company was founded by Mark R. Newcomer and Daniel H. Spencer on August 24, 1995 and is headquartered in Henderson, NV.
Related stocks

PAYS - potential to retest 2023 highNASDAQ:PAYS has broken out of its prior consolidation, reclaimed its 200SMA, and has just filled the measured range for the high and tight flag that it formed between October and December. It had a similar expansion pattern in 2022.
Using one Fibonacci fan from the low and support of 2022 and ano

PAYS - Possible TradeHello there,
As you can see PAYS is in the support line, we will add to our bag in this level.
* You can take profits all the way up.
* SL will be breaking the chanel.
*** This is not a financial advice, I'm still a beginner trying to share my Road here.
Happy Trade.

PAYS 1W TRADEHello Traders,
As you can see PAYS is in the support line, I expect to start raising in the upcoming days for a final target of 50% for us.
*** This is not a financial advice, I'm still a beginner trying to share my Road here.
Than you.

PAYS LongDemand Zone below consolidation
RSI Divergence
Entry 3.4
Stop 2.5
Target 10
Risk management is much more important than a good entry point.
The max Risk of each plan should be less than 1% of an account.
I am not a PRO trader. I trade option to test my trading plan with small cost.

It PAYS to be paytientWaiting for the consolidation to finish here. Weekly support/resistance is the strongest, may play calls up to the trend line on lower timeframes but like how these charts fill out!
Like/follow if you want to see more! Thank you

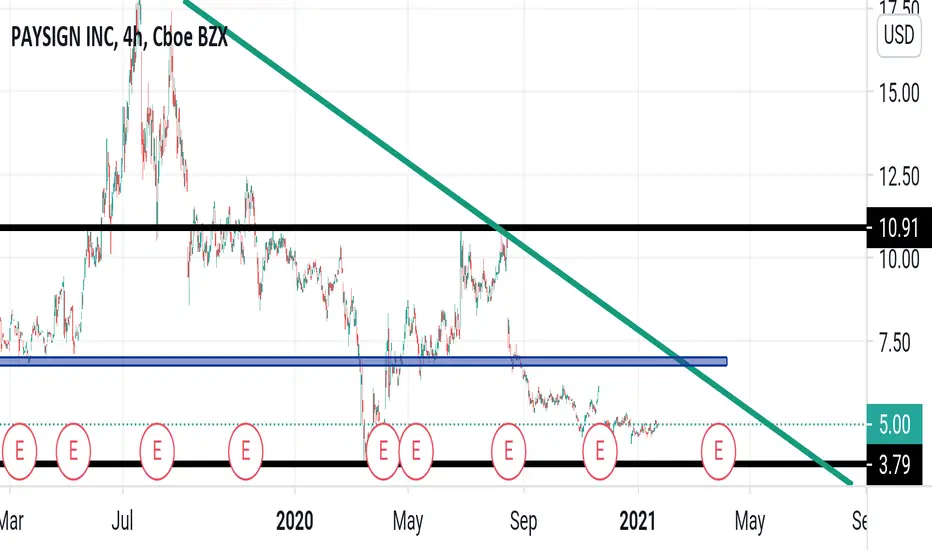
Paysign, a cheap buy Higher lows in the amazing oscillator.
Jumps in the accumulation/distribution indicator not reflected in the price properly.
70% below its all-time high in July 2019.
Close to a strong support level at $ 4.70.
Positive net profit margins.
Positive sales growth.
Moving average flattening.
With

+100% opportunity..!Potential gain:+100%
Reward/Risk:>7
Timeframe: 4months
This is just my technical view, neither a fundamental comment,nor a recommendation to trade..!
Don't forget to like, comment, and Follow to encourage me to continue this.
You can even send TradingView coins to support me publishing high qual

PAYS, Stochastic Oscillator left the oversold zone on Nov 03This is a signal that PAYS's price trend could be reversing, and it may be an opportunity to buy the stock or explore call options. Tickeron A.I.dvisor identified 59 similar cases where PAYS's stochastic oscillator exited the oversold zone, and 51 of them led to successful outcomes. Odds of Success:

See all ideas
Summarizing what the indicators are suggesting.
Neutral
SellBuy
Strong sellStrong buy
Strong sellSellNeutralBuyStrong buy
Neutral
SellBuy
Strong sellStrong buy
Strong sellSellNeutralBuyStrong buy
Neutral
SellBuy
Strong sellStrong buy
Strong sellSellNeutralBuyStrong buy
An aggregate view of professional's ratings.
Neutral
SellBuy
Strong sellStrong buy
Strong sellSellNeutralBuyStrong buy
Neutral
SellBuy
Strong sellStrong buy
Strong sellSellNeutralBuyStrong buy
Neutral
SellBuy
Strong sellStrong buy
Strong sellSellNeutralBuyStrong buy
Displays a symbol's price movements over previous years to identify recurring trends.
Frequently Asked Questions
The current price of PAYS is 7.14 USD — it has decreased by −4.03% in the past 24 hours. Watch Paysign, Inc. stock price performance more closely on the chart.
Depending on the exchange, the stock ticker may vary. For instance, on NASDAQ exchange Paysign, Inc. stocks are traded under the ticker PAYS.
PAYS stock has fallen by −16.78% compared to the previous week, the month change is a −5.56% fall, over the last year Paysign, Inc. has showed a 27.73% increase.
We've gathered analysts' opinions on Paysign, Inc. future price: according to them, PAYS price has a max estimate of 9.50 USD and a min estimate of 5.00 USD. Watch PAYS chart and read a more detailed Paysign, Inc. stock forecast: see what analysts think of Paysign, Inc. and suggest that you do with its stocks.
PAYS reached its all-time high on Apr 13, 1998 with the price of 60.00 USD, and its all-time low was 0.002 USD and was reached on Jan 30, 2009. View more price dynamics on PAYS chart.
See other stocks reaching their highest and lowest prices.
See other stocks reaching their highest and lowest prices.
PAYS stock is 6.90% volatile and has beta coefficient of 2.37. Track Paysign, Inc. stock price on the chart and check out the list of the most volatile stocks — is Paysign, Inc. there?
Today Paysign, Inc. has the market capitalization of 403.38 M, it has increased by 1.02% over the last week.
Yes, you can track Paysign, Inc. financials in yearly and quarterly reports right on TradingView.
Paysign, Inc. is going to release the next earnings report on Aug 5, 2025. Keep track of upcoming events with our Earnings Calendar.
PAYS earnings for the last quarter are 0.05 USD per share, whereas the estimation was 0.02 USD resulting in a 199.99% surprise. The estimated earnings for the next quarter are 0.04 USD per share. See more details about Paysign, Inc. earnings.
Paysign, Inc. revenue for the last quarter amounts to 18.60 M USD, despite the estimated figure of 17.49 M USD. In the next quarter, revenue is expected to reach 18.69 M USD.
PAYS net income for the last quarter is 2.59 M USD, while the quarter before that showed 1.37 M USD of net income which accounts for 88.37% change. Track more Paysign, Inc. financial stats to get the full picture.
No, PAYS doesn't pay any dividends to its shareholders. But don't worry, we've prepared a list of high-dividend stocks for you.
As of Aug 1, 2025, the company has 173 employees. See our rating of the largest employees — is Paysign, Inc. on this list?
EBITDA measures a company's operating performance, its growth signifies an improvement in the efficiency of a company. Paysign, Inc. EBITDA is 10.28 M USD, and current EBITDA margin is 12.02%. See more stats in Paysign, Inc. financial statements.
Like other stocks, PAYS shares are traded on stock exchanges, e.g. Nasdaq, Nyse, Euronext, and the easiest way to buy them is through an online stock broker. To do this, you need to open an account and follow a broker's procedures, then start trading. You can trade Paysign, Inc. stock right from TradingView charts — choose your broker and connect to your account.
Investing in stocks requires a comprehensive research: you should carefully study all the available data, e.g. company's financials, related news, and its technical analysis. So Paysign, Inc. technincal analysis shows the sell today, and its 1 week rating is buy. Since market conditions are prone to changes, it's worth looking a bit further into the future — according to the 1 month rating Paysign, Inc. stock shows the buy signal. See more of Paysign, Inc. technicals for a more comprehensive analysis.
If you're still not sure, try looking for inspiration in our curated watchlists.
If you're still not sure, try looking for inspiration in our curated watchlists.